
The Changing UK GenAI Adoption Landscape
October 19, 2025
Reveals real LLM adoption patterns across UK demographics, education, and employment sectors.
Learn morePublished November 17, 2025
"10% of users drive 62% of visits" with demographic breakdowns by age, gender, employment.

Headline growth numbers make GenAI adoption look broad-based, but our UK clickstream data from September 2025 tells a more concentrated story. Visits to major GenAI platforms follow a textbook Pareto distribution: a small core of power users is doing most of the work, and everyone else is a much lighter touch.
The 80/20 rule (the idea that a small share of participants generates the majority of activity) shows up almost exactly in how people use GenAI. The top 20% of users are responsible for 79% of all visits across major GenAI platforms.
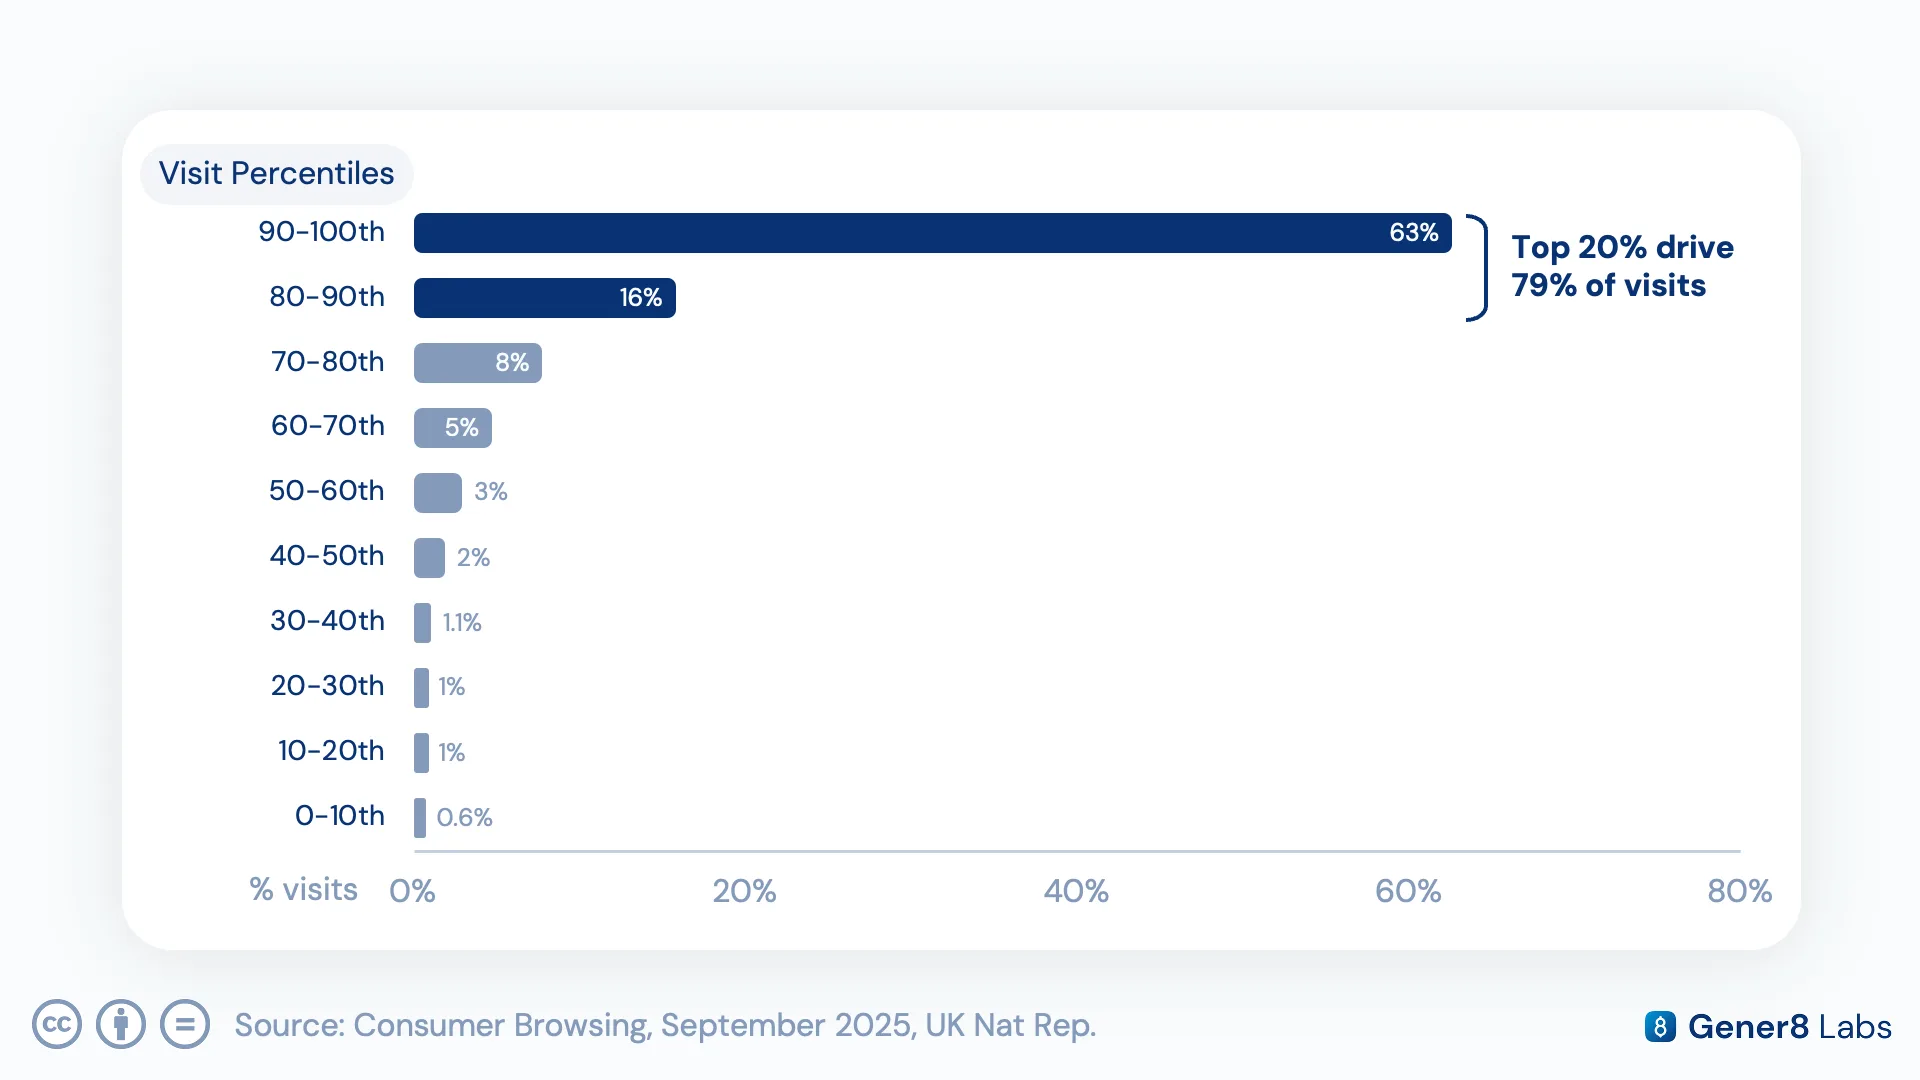
Narrow that further and the concentration only deepens: the top 10% of users alone account for 62% of all visits. The typical GenAI user, in other words, is far lighter than the average implied by aggregate growth charts: the boom is being carried by a committed minority.
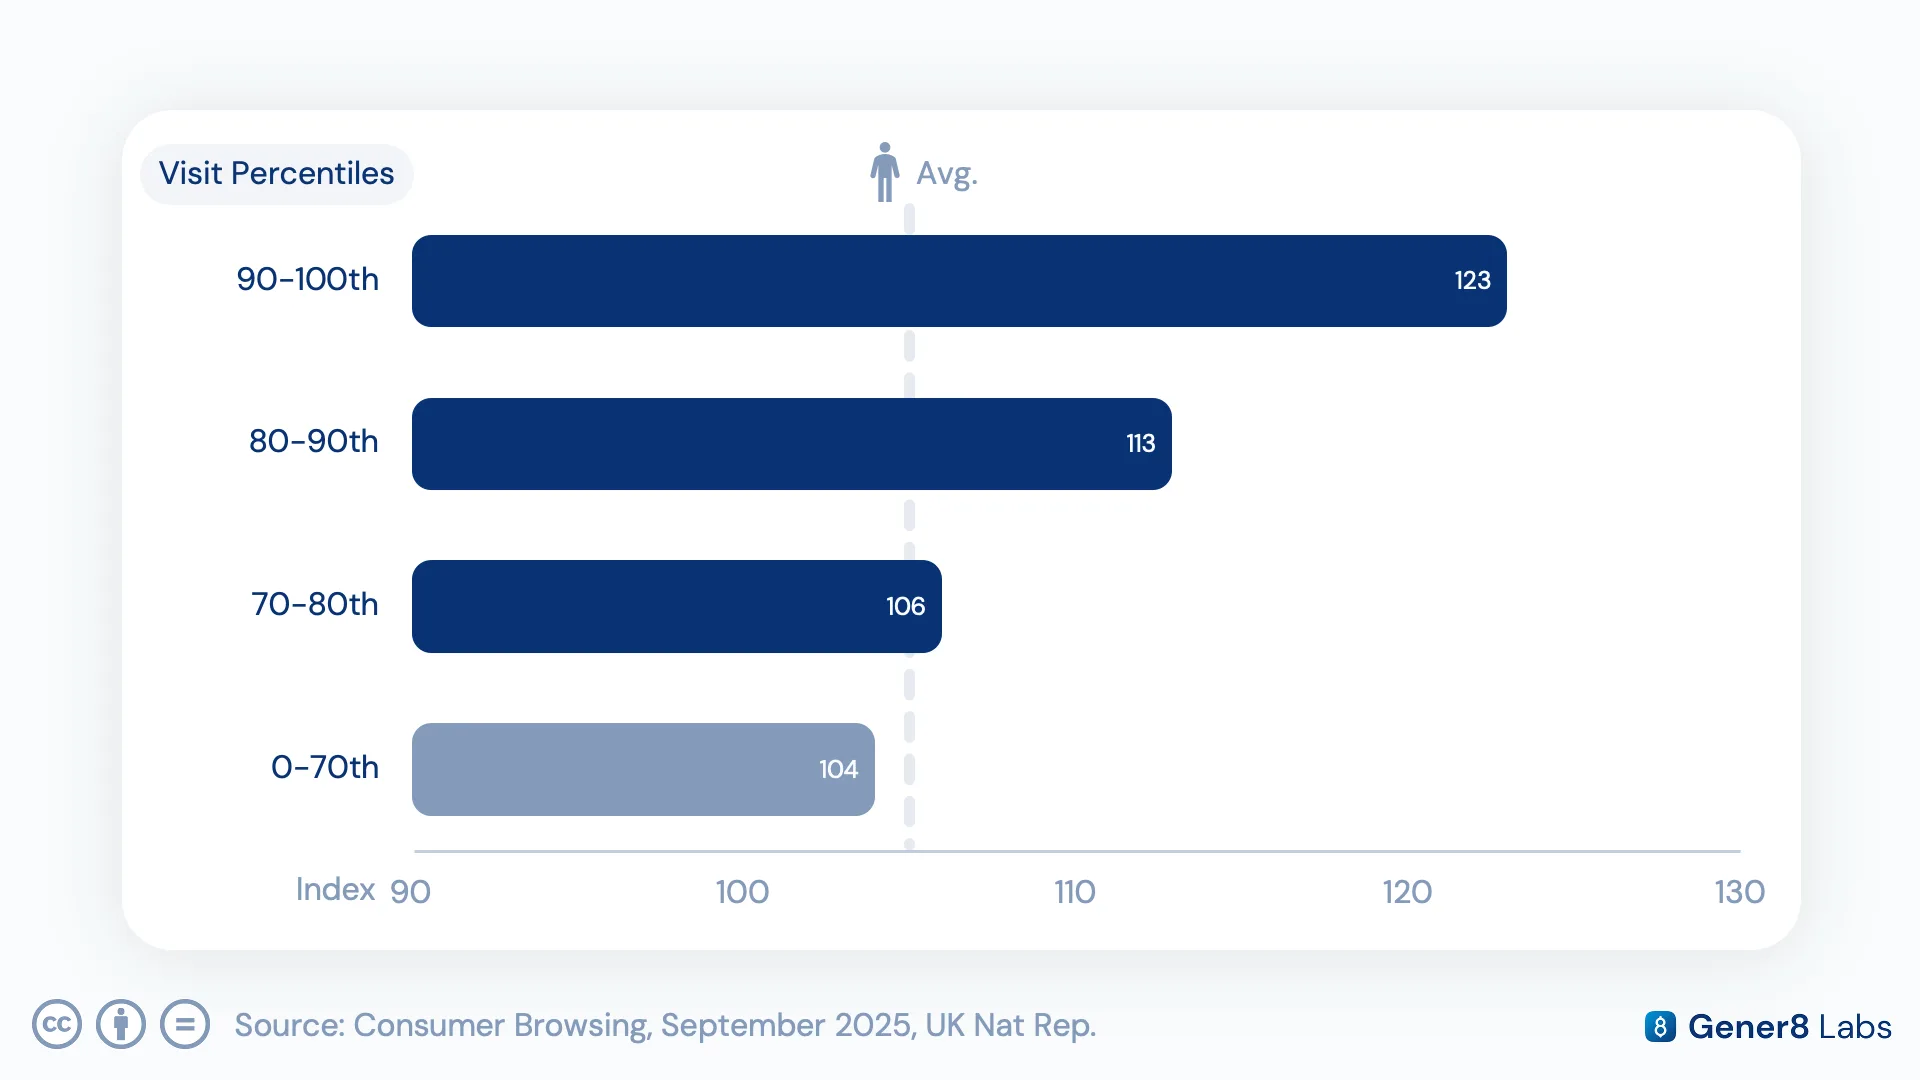
Men significantly overindex among power users, sitting at an index of 123 against an overall benchmark of 105. The gap shows up in the numbers directly: the top 10% of male users generate 66% of all visits from men, compared with 58% from the top 10% of female users, meaning female usage is somewhat more evenly spread across the base.
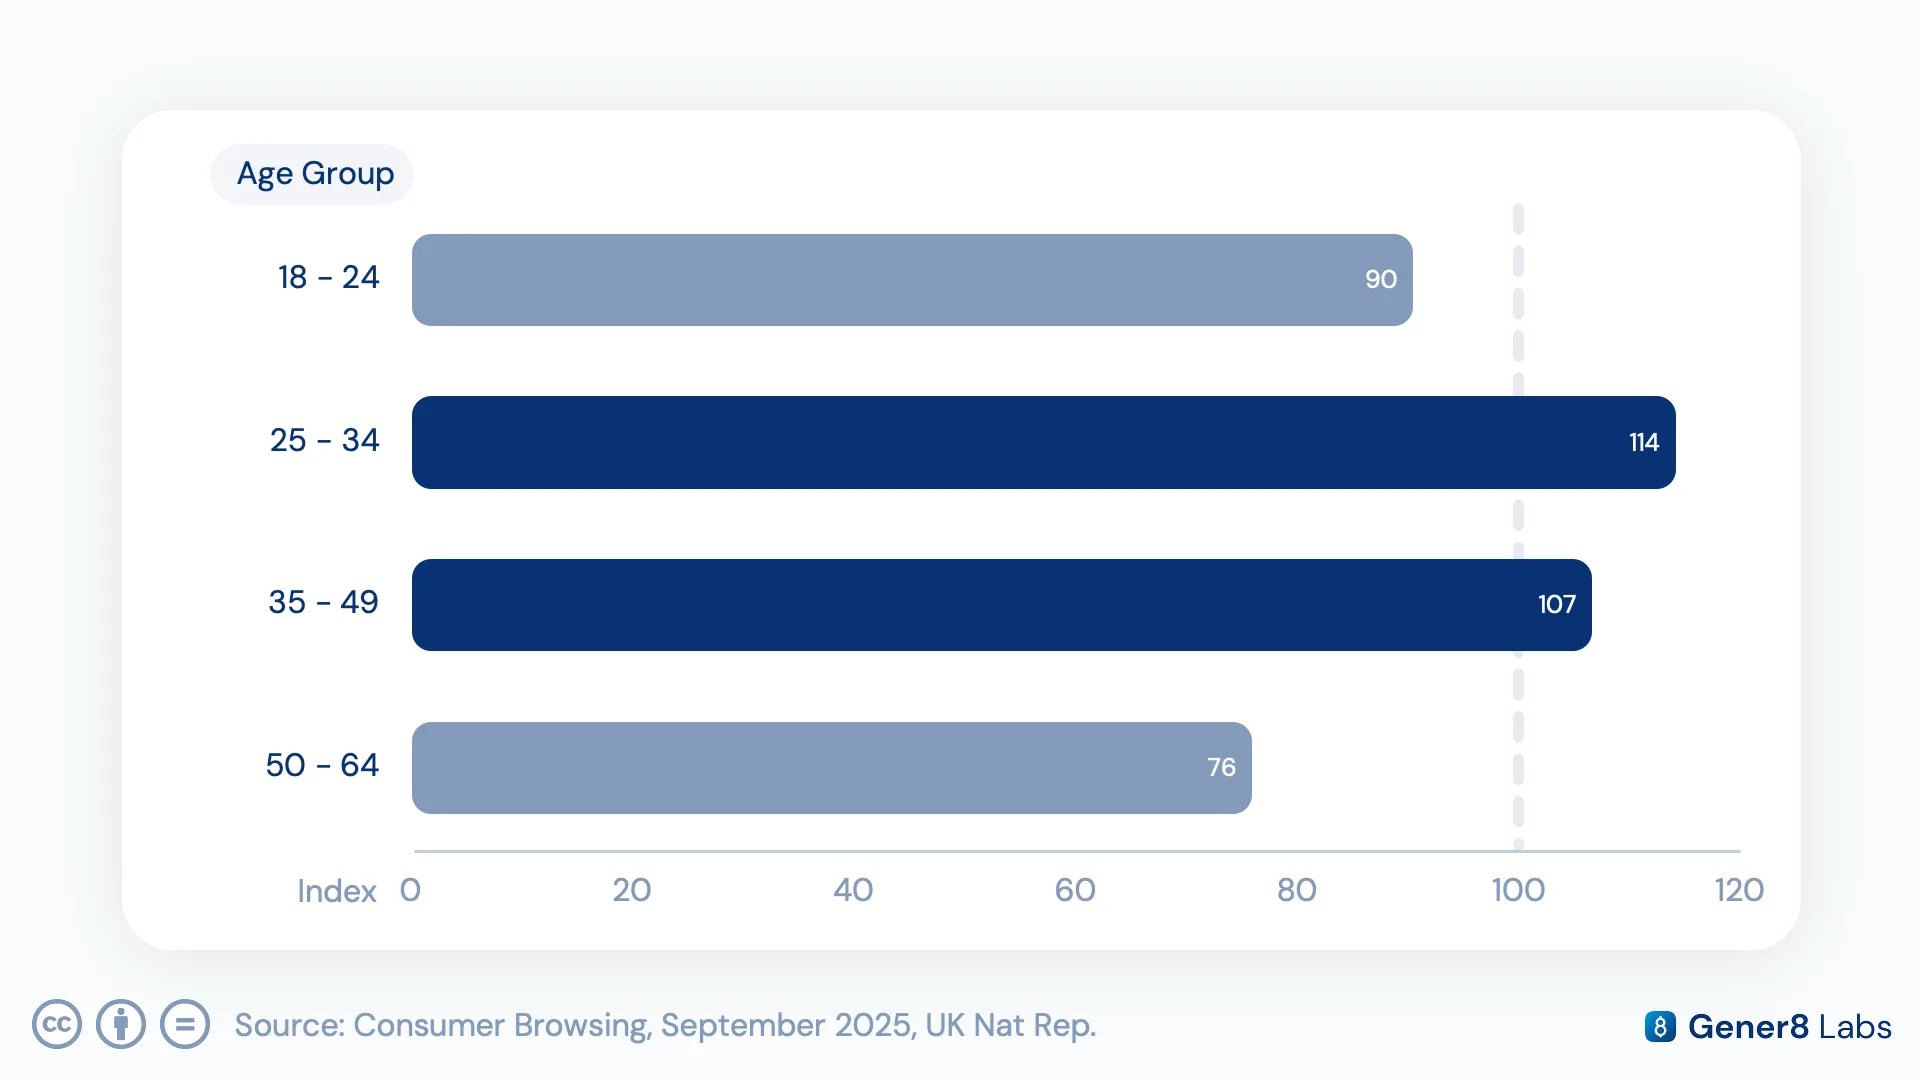
Power usage peaks during core working years, with 25-34 year-olds indexing at 114 and 35-49 year-olds at 107. Notably, 18-24 year-olds underindex at 91, a result that cuts against the common assumption that younger users are the primary force behind GenAI's growth.
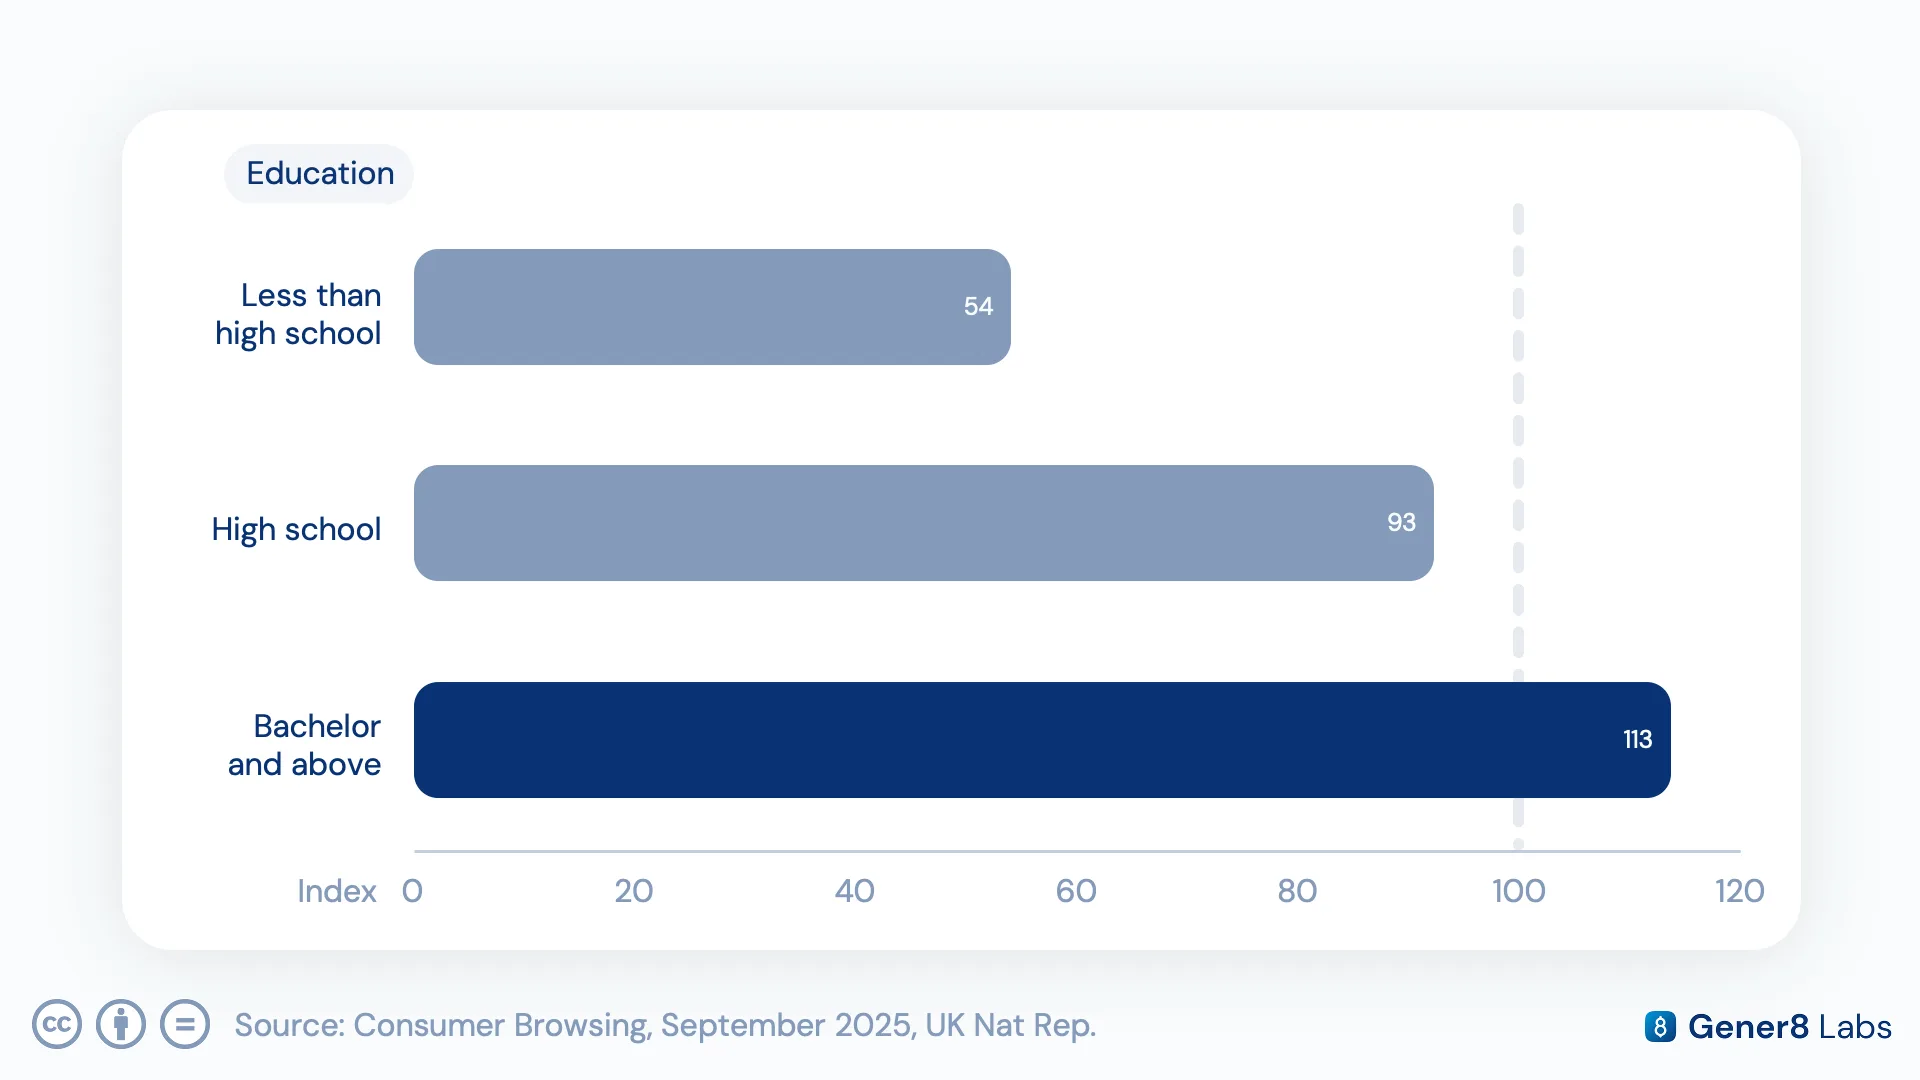
Education shows an even cleaner split: users with a bachelor's degree or higher index at 113, while those with less than a high school education index at just 54.
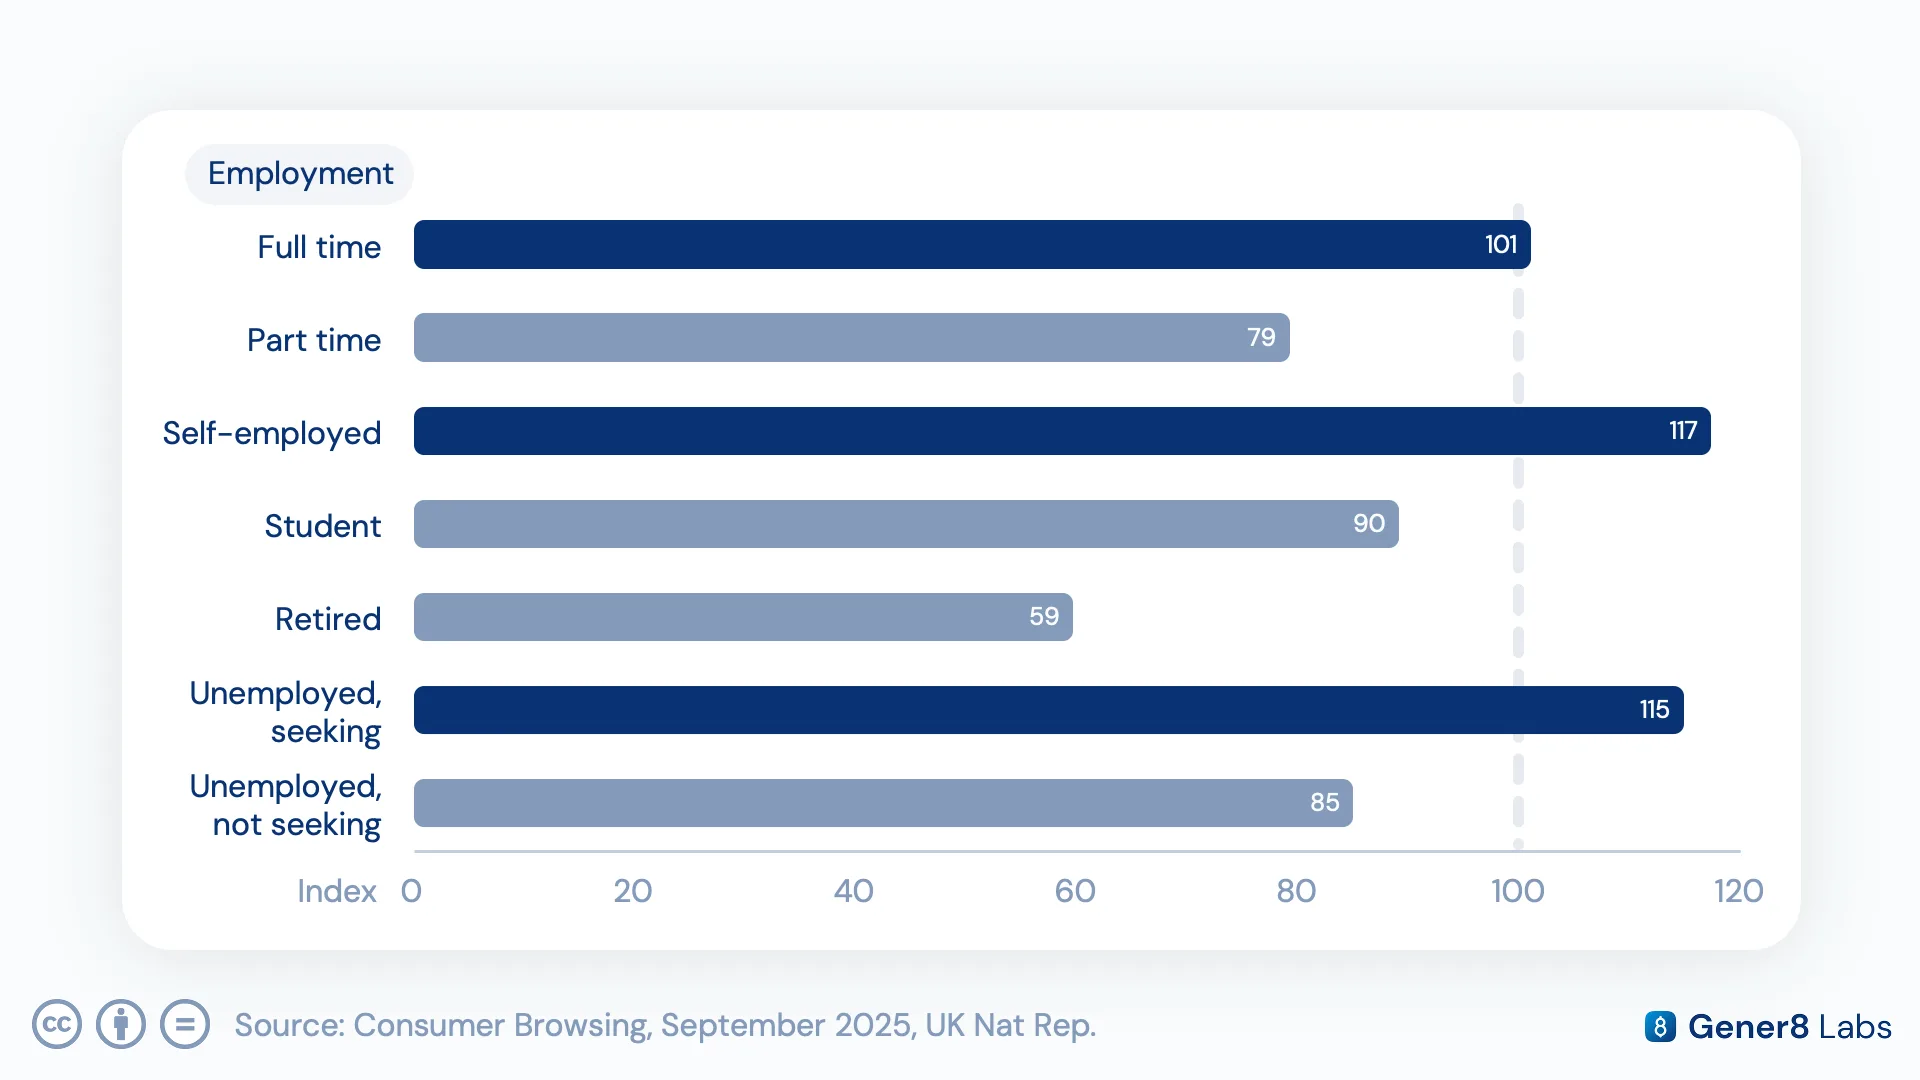
Self-employed users overindex strongly at 117, as do active job seekers at 114, both groups with clear, high-stakes reasons to lean on AI regularly. Full-time employees sit close to the overall benchmark at 101, while students actually underindex at 90, suggesting their GenAI use, while frequent among younger users generally, tends to be occasional rather than the daily habit seen among the self-employed and job-hunting cohorts.
This analysis draws on Gener8's Consumer Browsing dataset layered with panel demographics, tracking real visits to major GenAI platforms and ranking users by intensity of use. Get in touch to see how the same data can benchmark your own audience's GenAI engagement against the wider UK panel.