
Unlocking UK Travel Trends with Multi-Source Analysis
November 21, 2024
Multiple datasets linked by a persistent user ID reveal advanced travel behavior and brand preferences.
Learn morePublished November 27, 2024
Combining passive data with survey responses reveals food delivery habits and survey accuracy.
Gener8 sits on a large volume of passive user data, but there are still gaps: attitudes and self-perceptions that behavior alone can't capture. To close them, we launched the Gener8 Snapshot survey, more than 50 demographic, attitudinal, and interest questions fielded across our panel. Connecting those answers back to passive purchase data, using diet-related responses and food delivery activity on Deliveroo and Uber Eats as the test case, shows exactly what that combination can uncover.
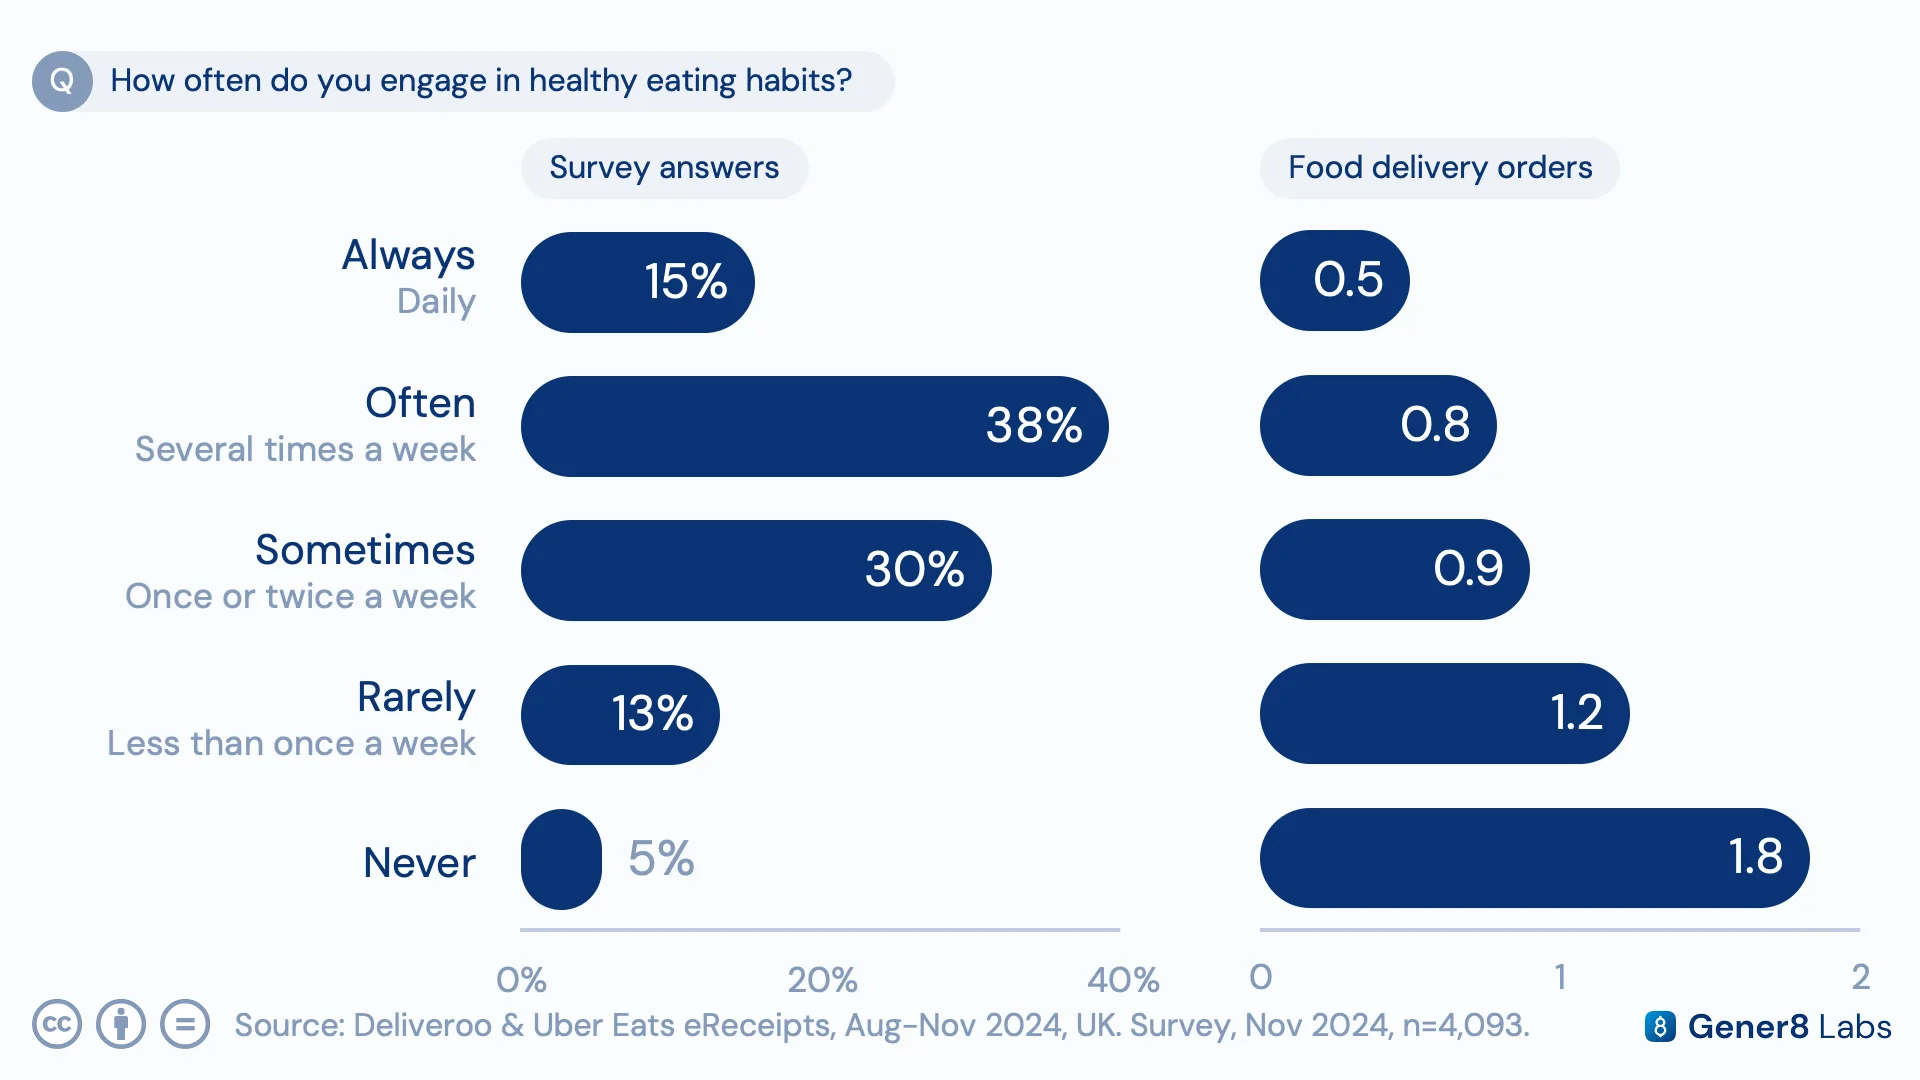
Linking survey answers to passive purchase behavior through a single user ID makes it possible to check self-reported habits against what people actually do. Respondents who said they consistently eat healthily placed noticeably fewer food delivery orders, while those who said they never maintain healthy eating habits ordered 3.6 times more often than the health-conscious group.
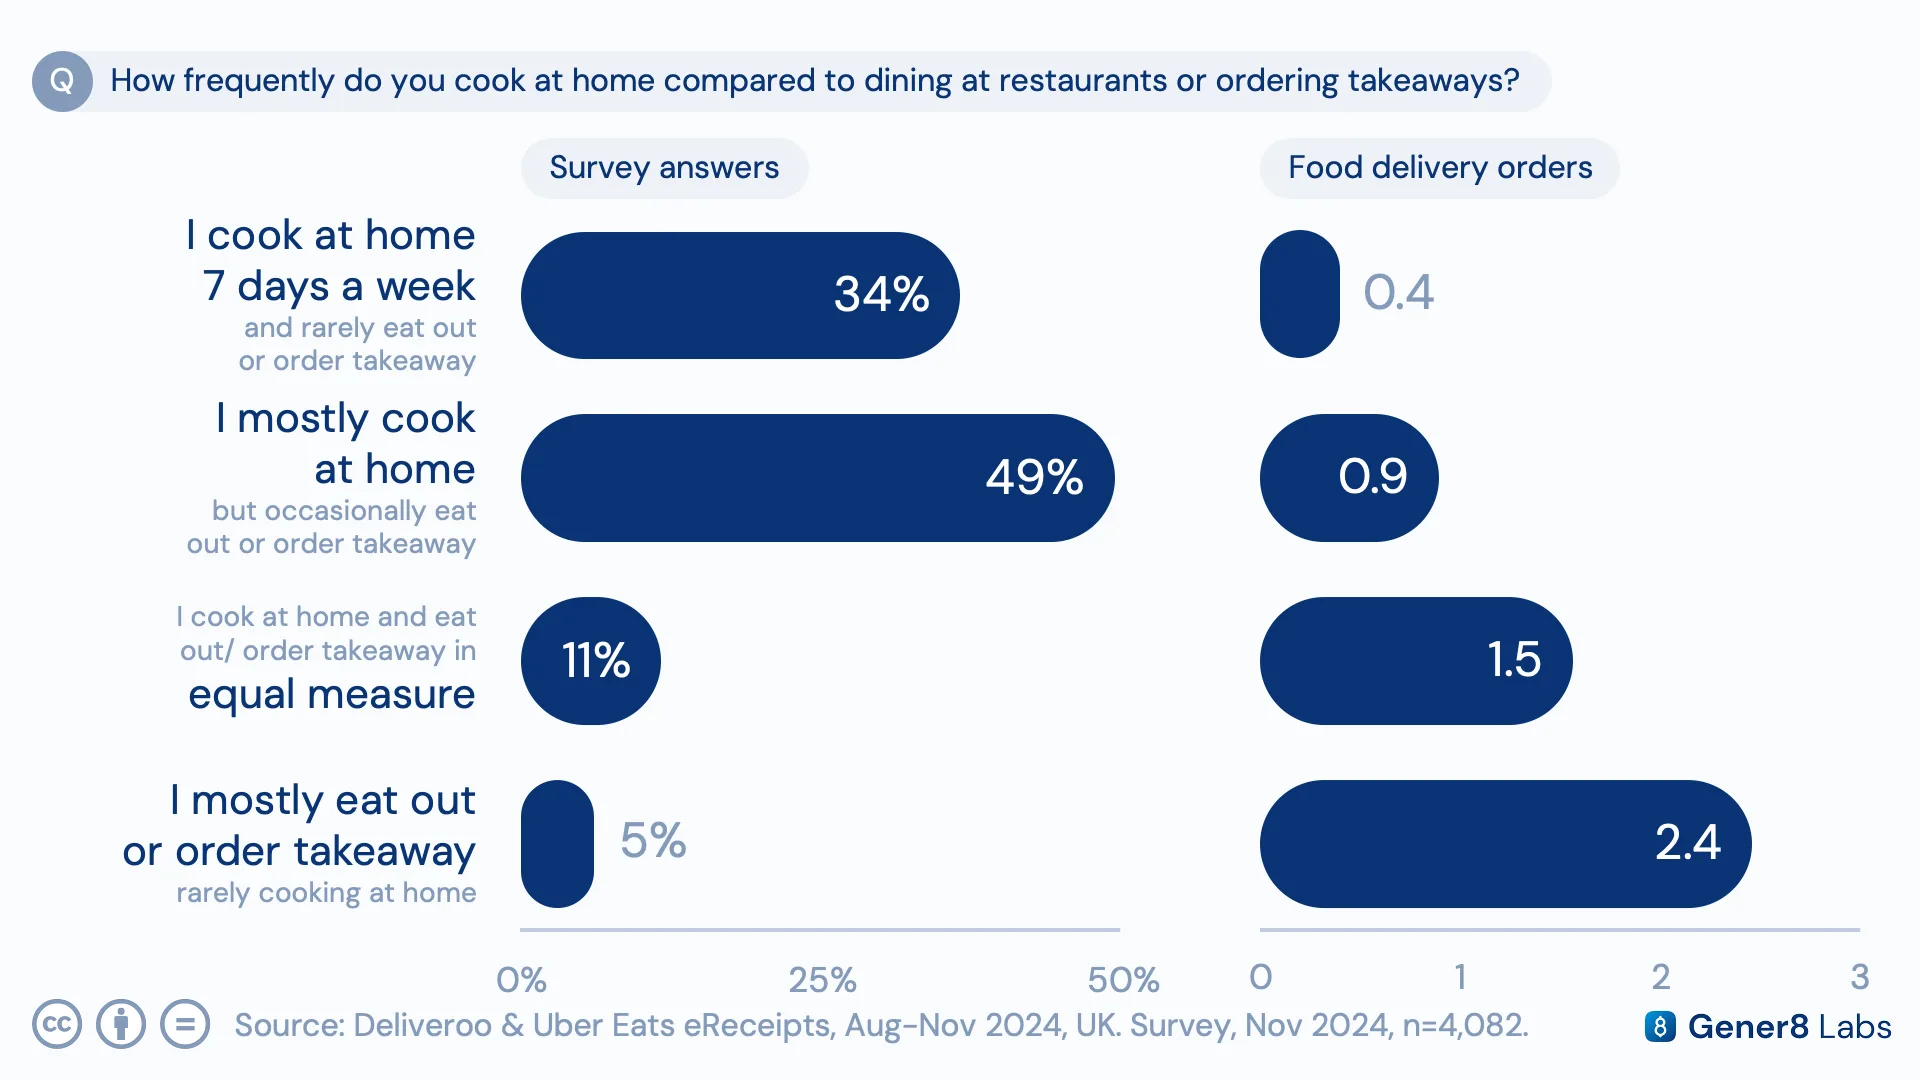
The same approach helps flag where survey responses may be skewed. People who said they cook at home daily placed the fewest delivery orders of any group, while those who said they mostly eat out or order takeaway placed six times as many orders as the daily home cooks, a gap wide enough to validate the survey responses rather than take them at face value.
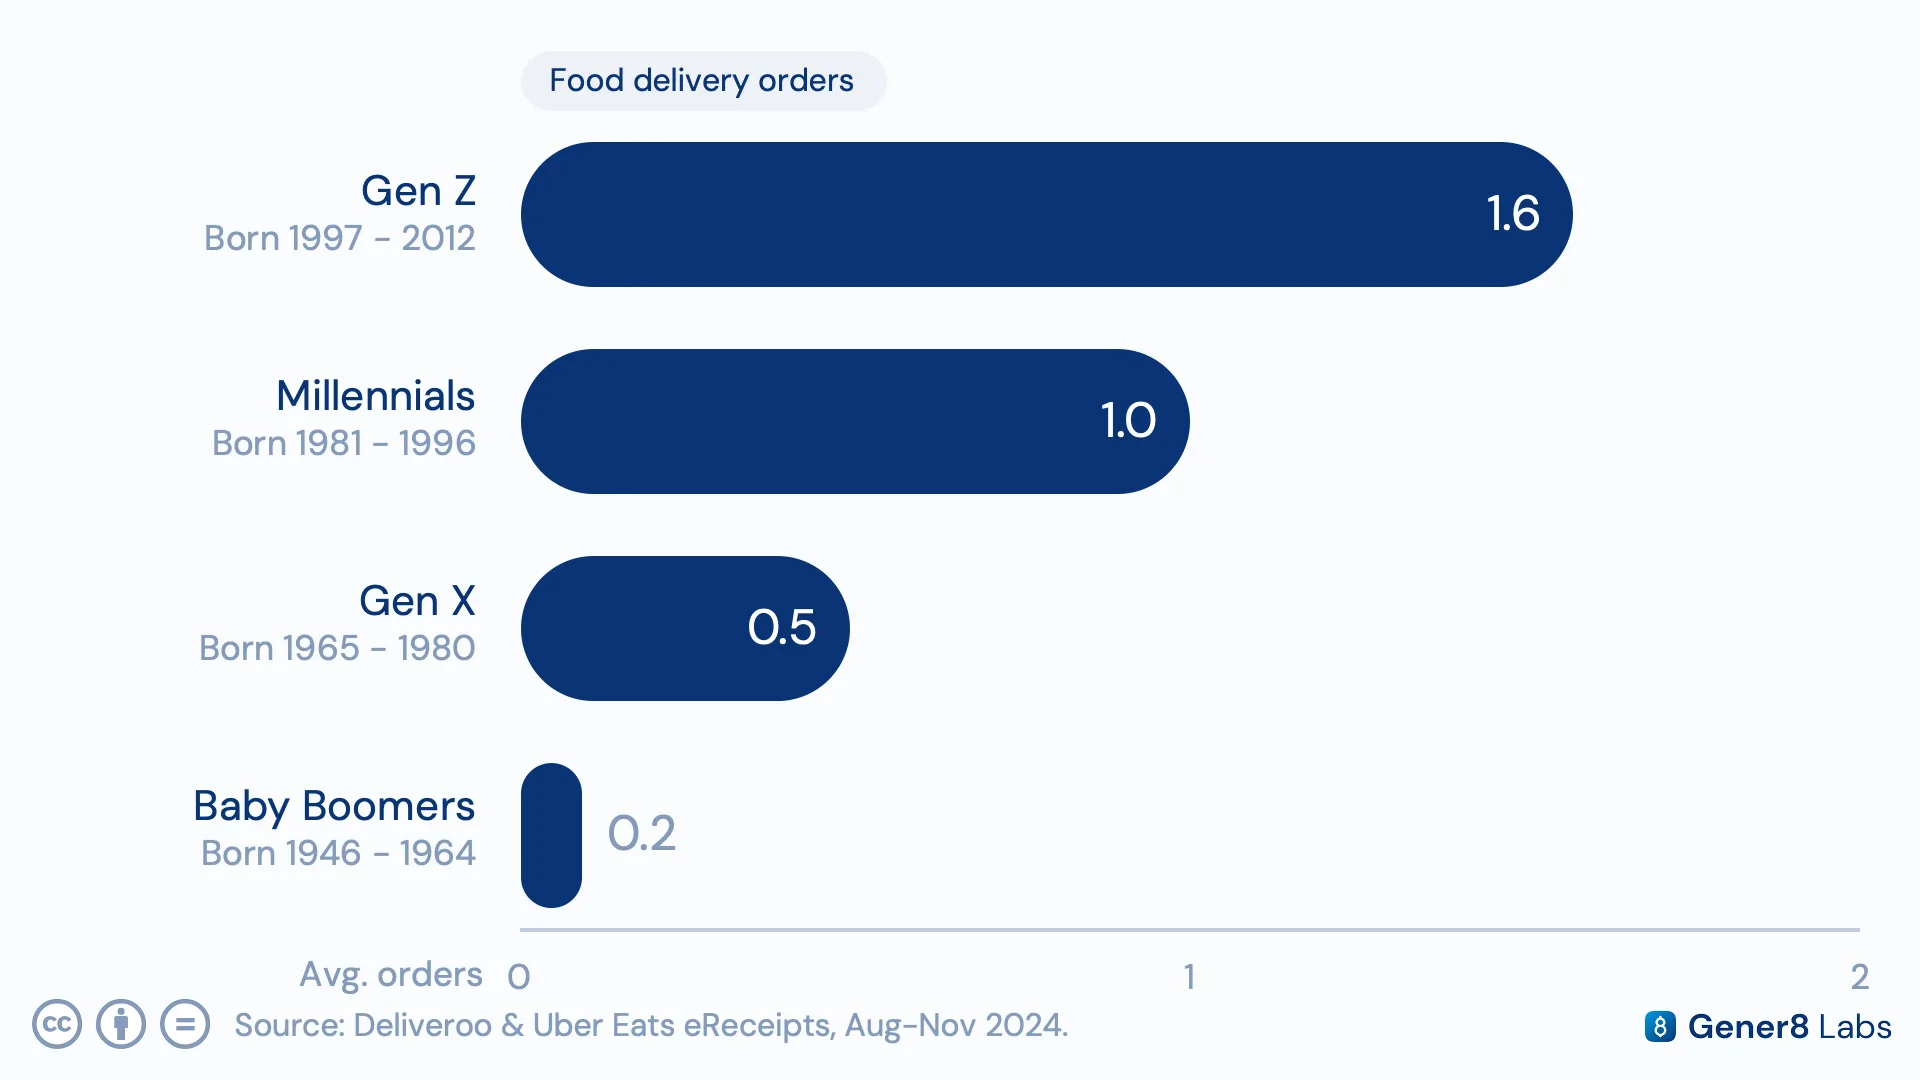
Age and gender remain foundational, and the data bears that out clearly: younger generations account for the large majority of frequent food delivery orders, while the behavior is almost entirely absent among Baby Boomers. Once core demographics are already covered by passive data, survey questions can focus on what behavior can't answer, shortening the survey without losing signal.
This analysis combines Gener8's Snapshot survey responses with passive eReceipts purchase data, connected around a single user ID. Get in touch to see how pairing survey and passive data can sharpen (and shorten) your own research.