
What YouTube Consumption Reveals About Your Audience
October 23, 2024
CultureMedia
YouTube API combined with demographic data uncovers audience trends and content behaviors.
Learn morePublished November 6, 2024
Pageview dataset reveals browsing habits and demographic insights across retail and career sectors.
Every month, UK consumers generate billions of website visits across thousands of domains. Making sense of that volume means grouping it, and Gener8's Pageview dataset, classified against IAB categories and layered with demographic data from a nationally representative panel, lets us see collective browsing behaviour by category rather than by site alone. The result is a live map of where UK attention goes, from shopping to careers, and how that map shifts month to month.
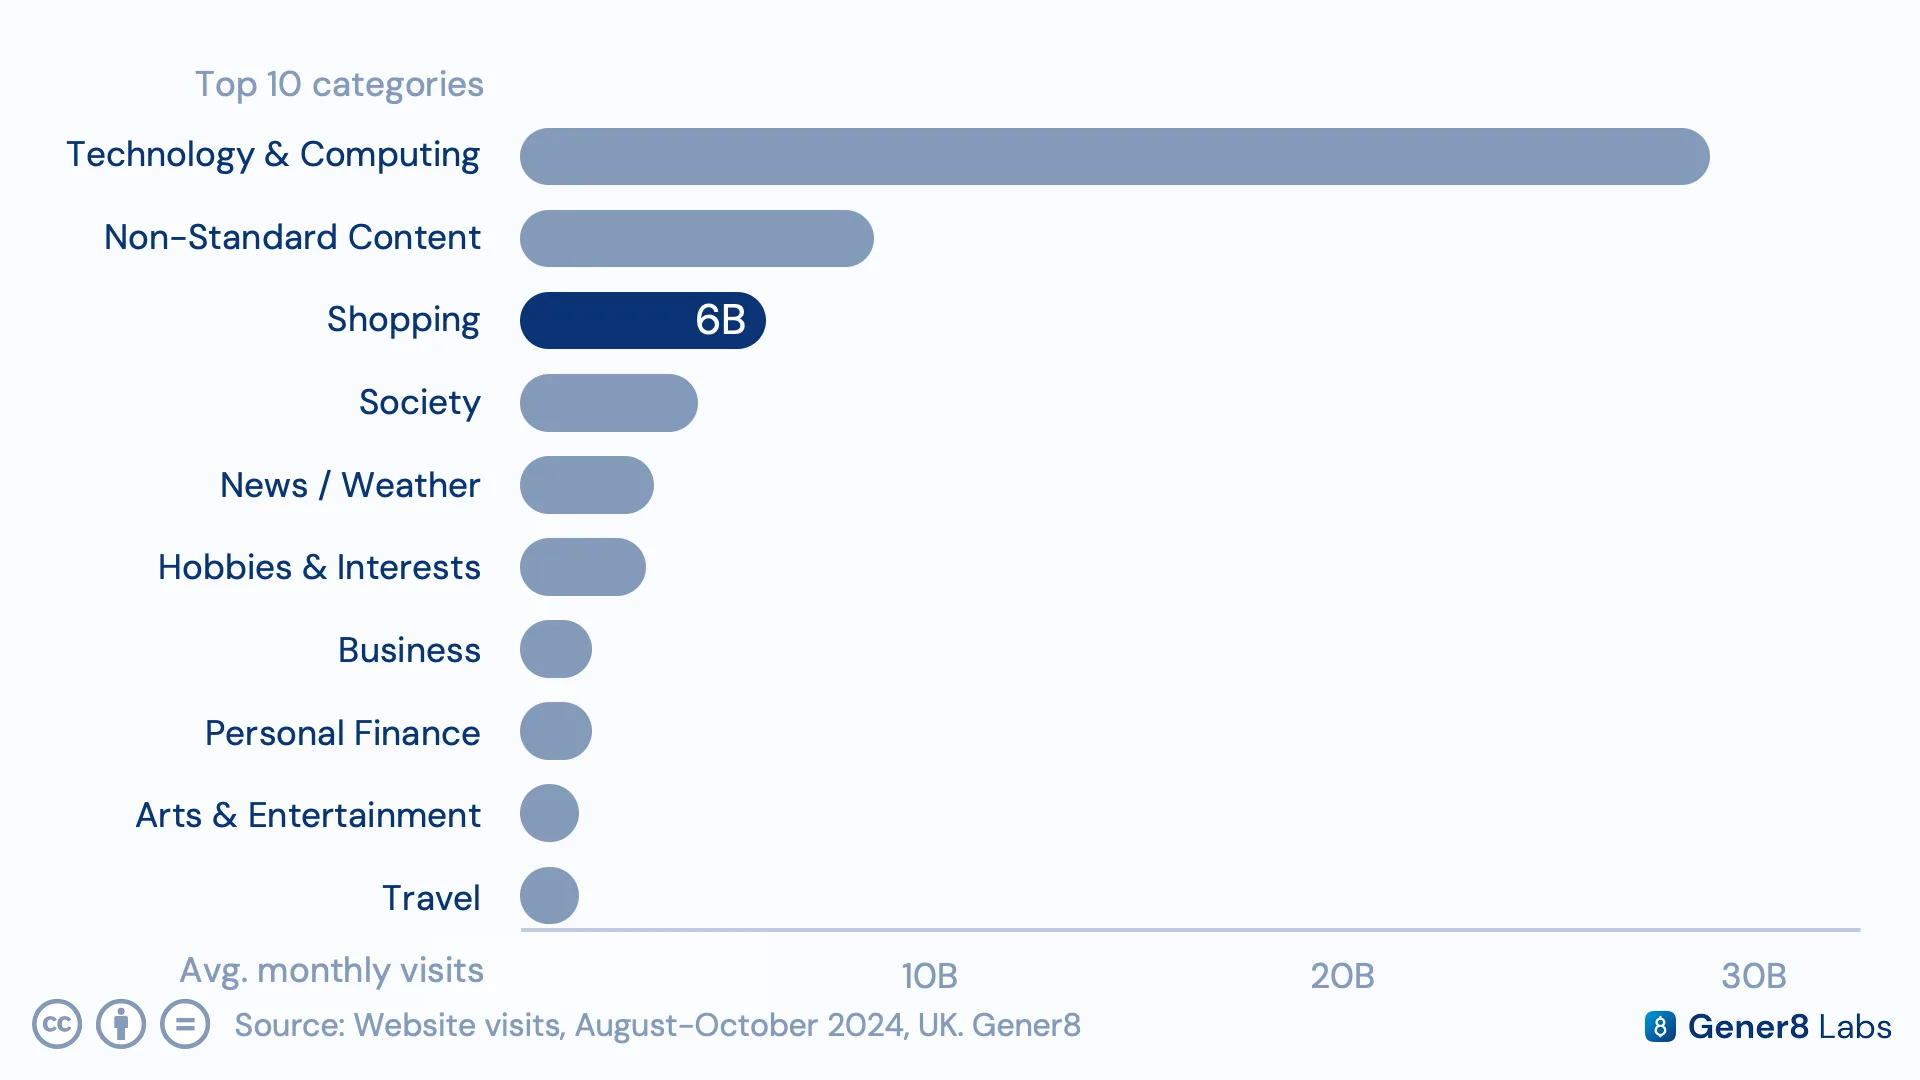
Quantifying engagement at the category level shows Shopping as the third-largest category by visit volume in the UK, generating roughly 6 billion monthly site visits, 8.6% of all tracked traffic.
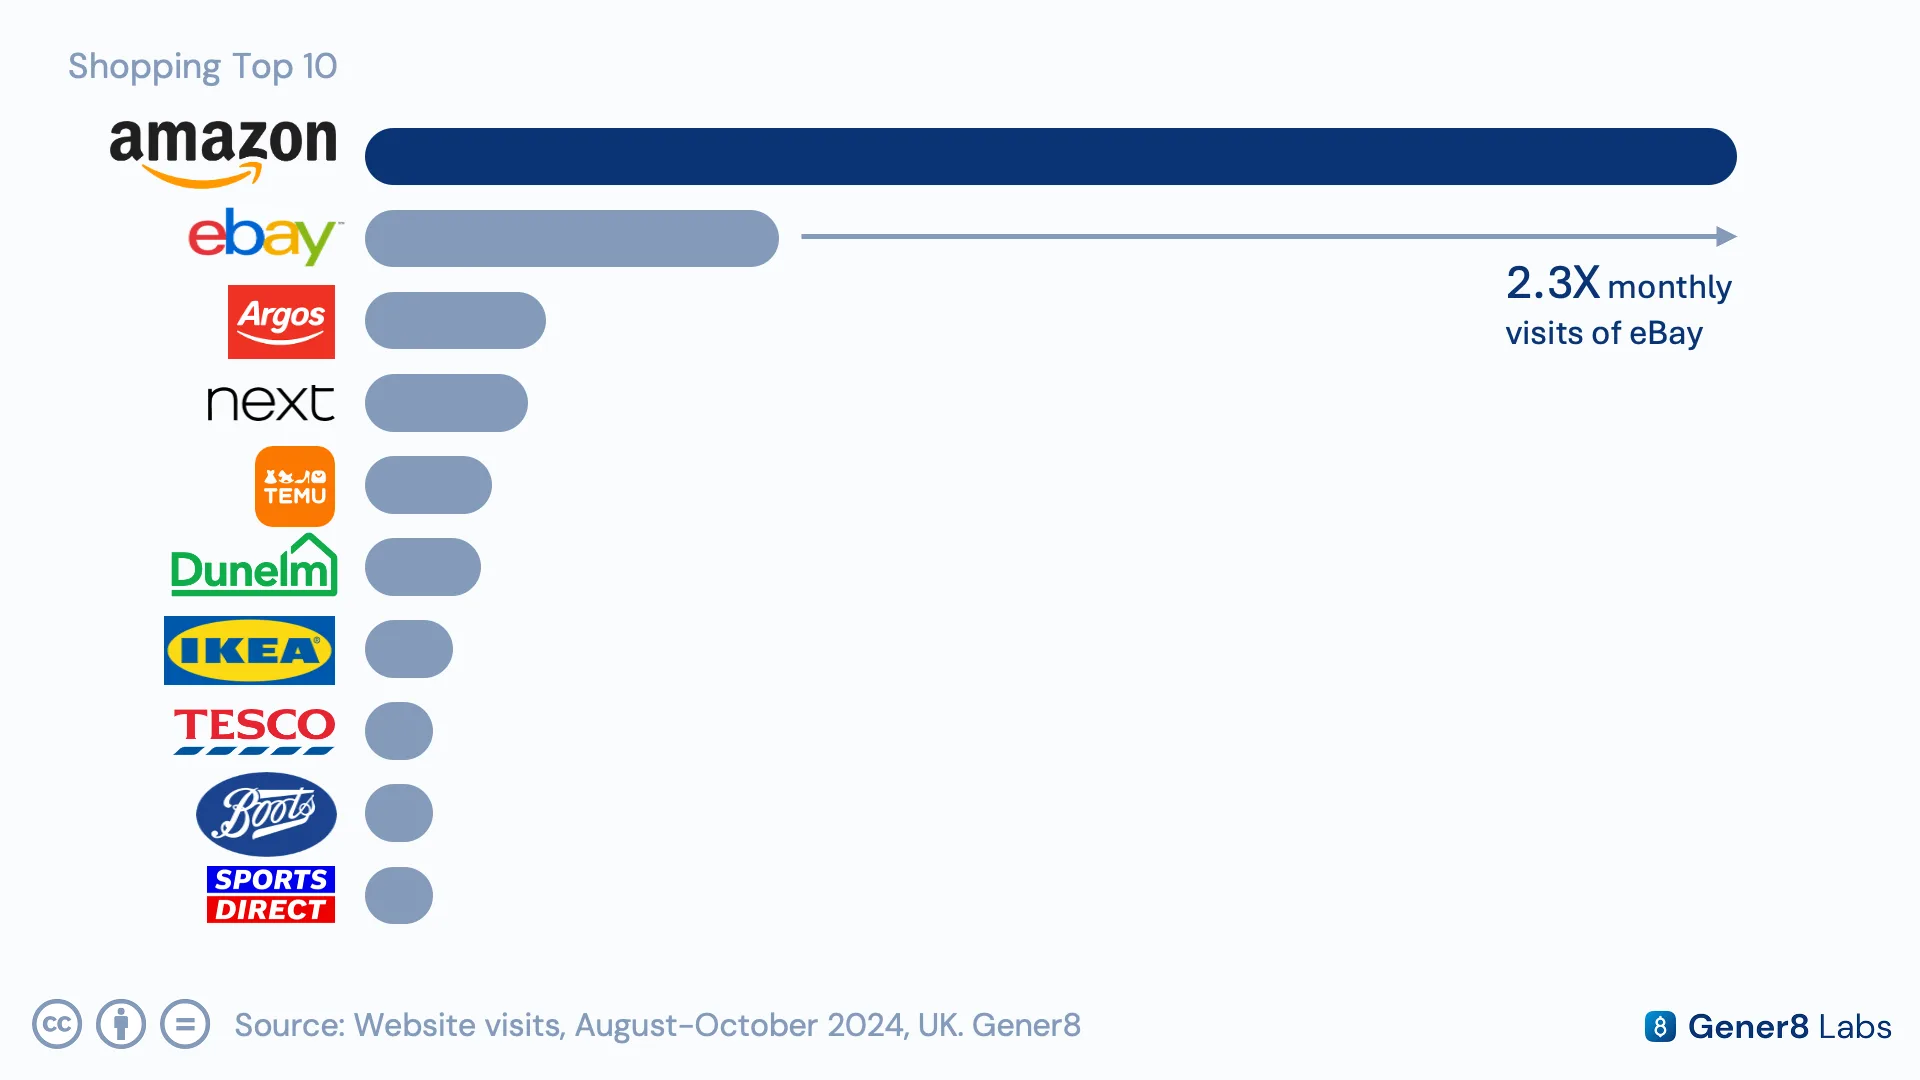
Within that category, Amazon dominates: it pulls in 2.3 times more traffic than its nearest large rival, eBay, reinforcing just how much of UK retail browsing now happens inside a single ecosystem.
Category rankings are far from static, either. Tracking domain performance over time gives an early read on when seasonal categories start pulling traffic away from the everyday leaders.
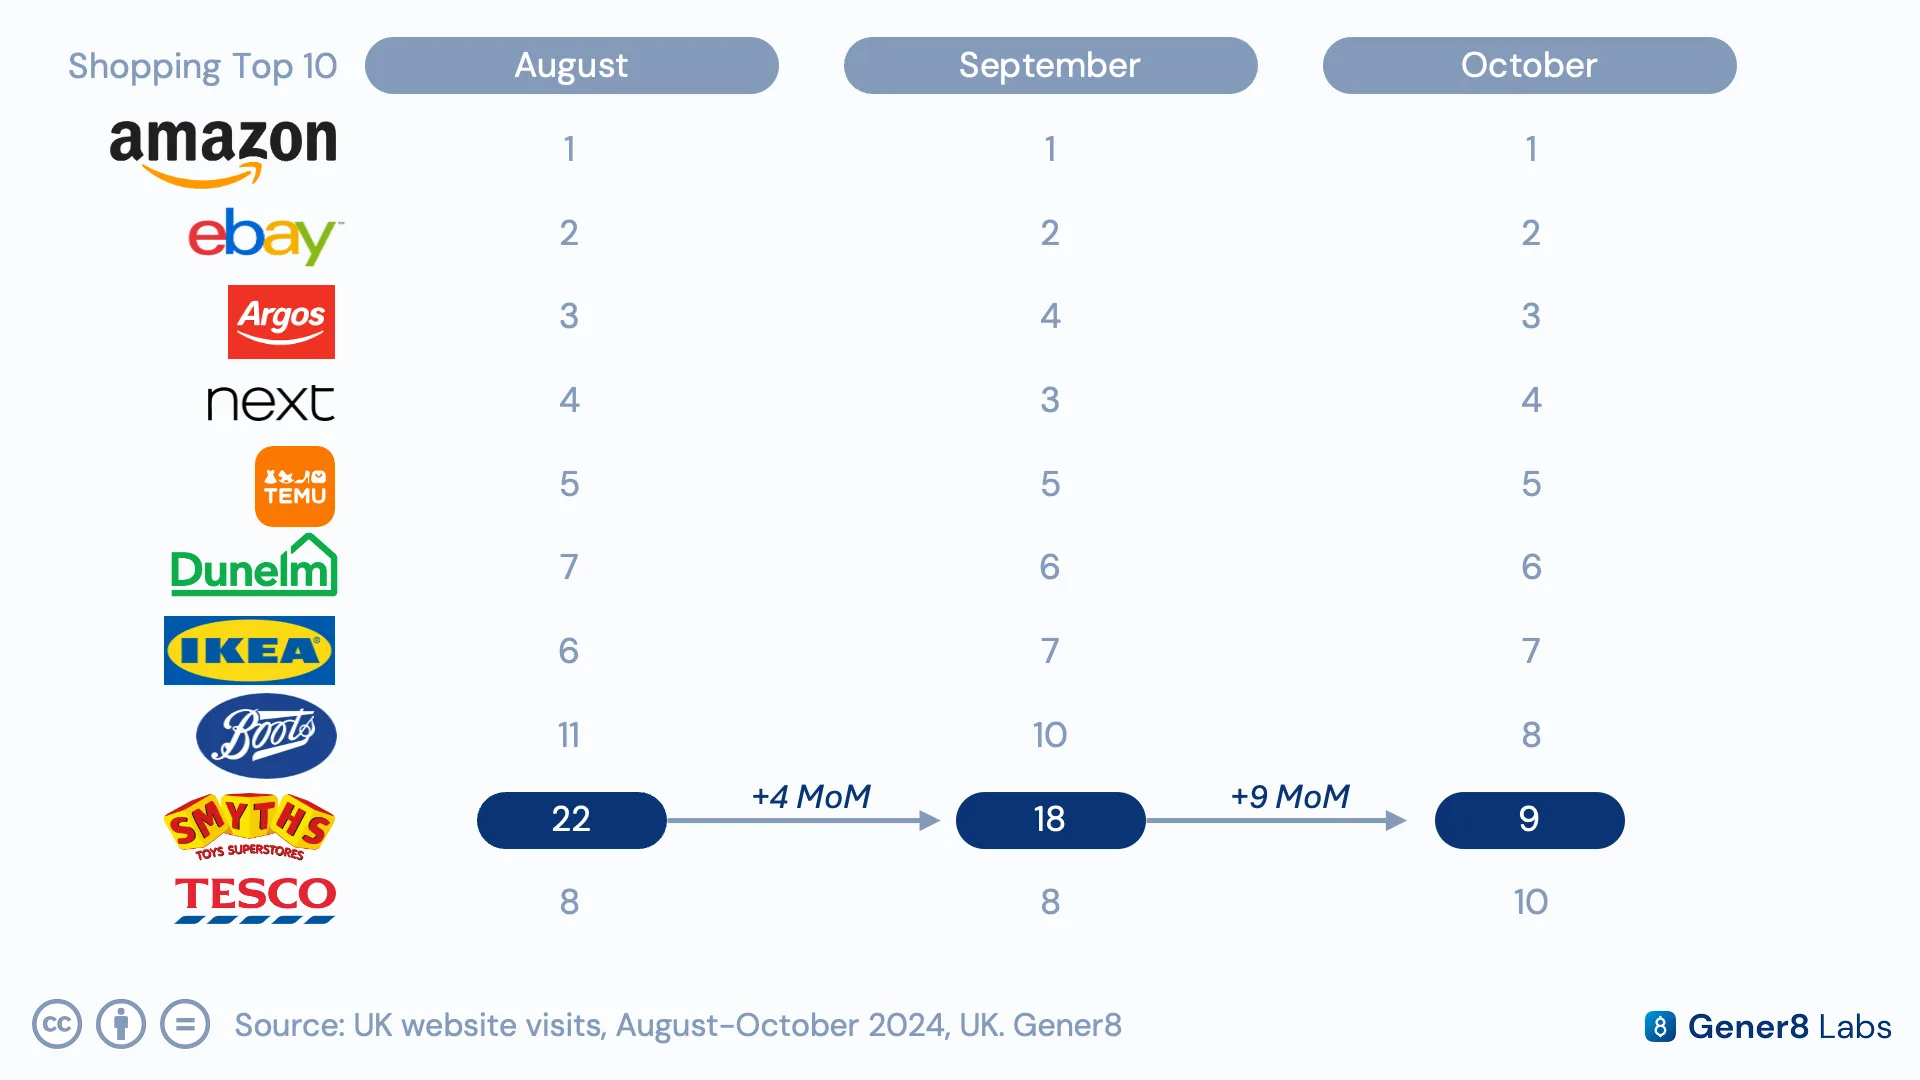
Smyths Toys climbed from the 22nd-largest shopping domain in August to 9th by October, a jump directly attributable to rising toy search demand ahead of Christmas.
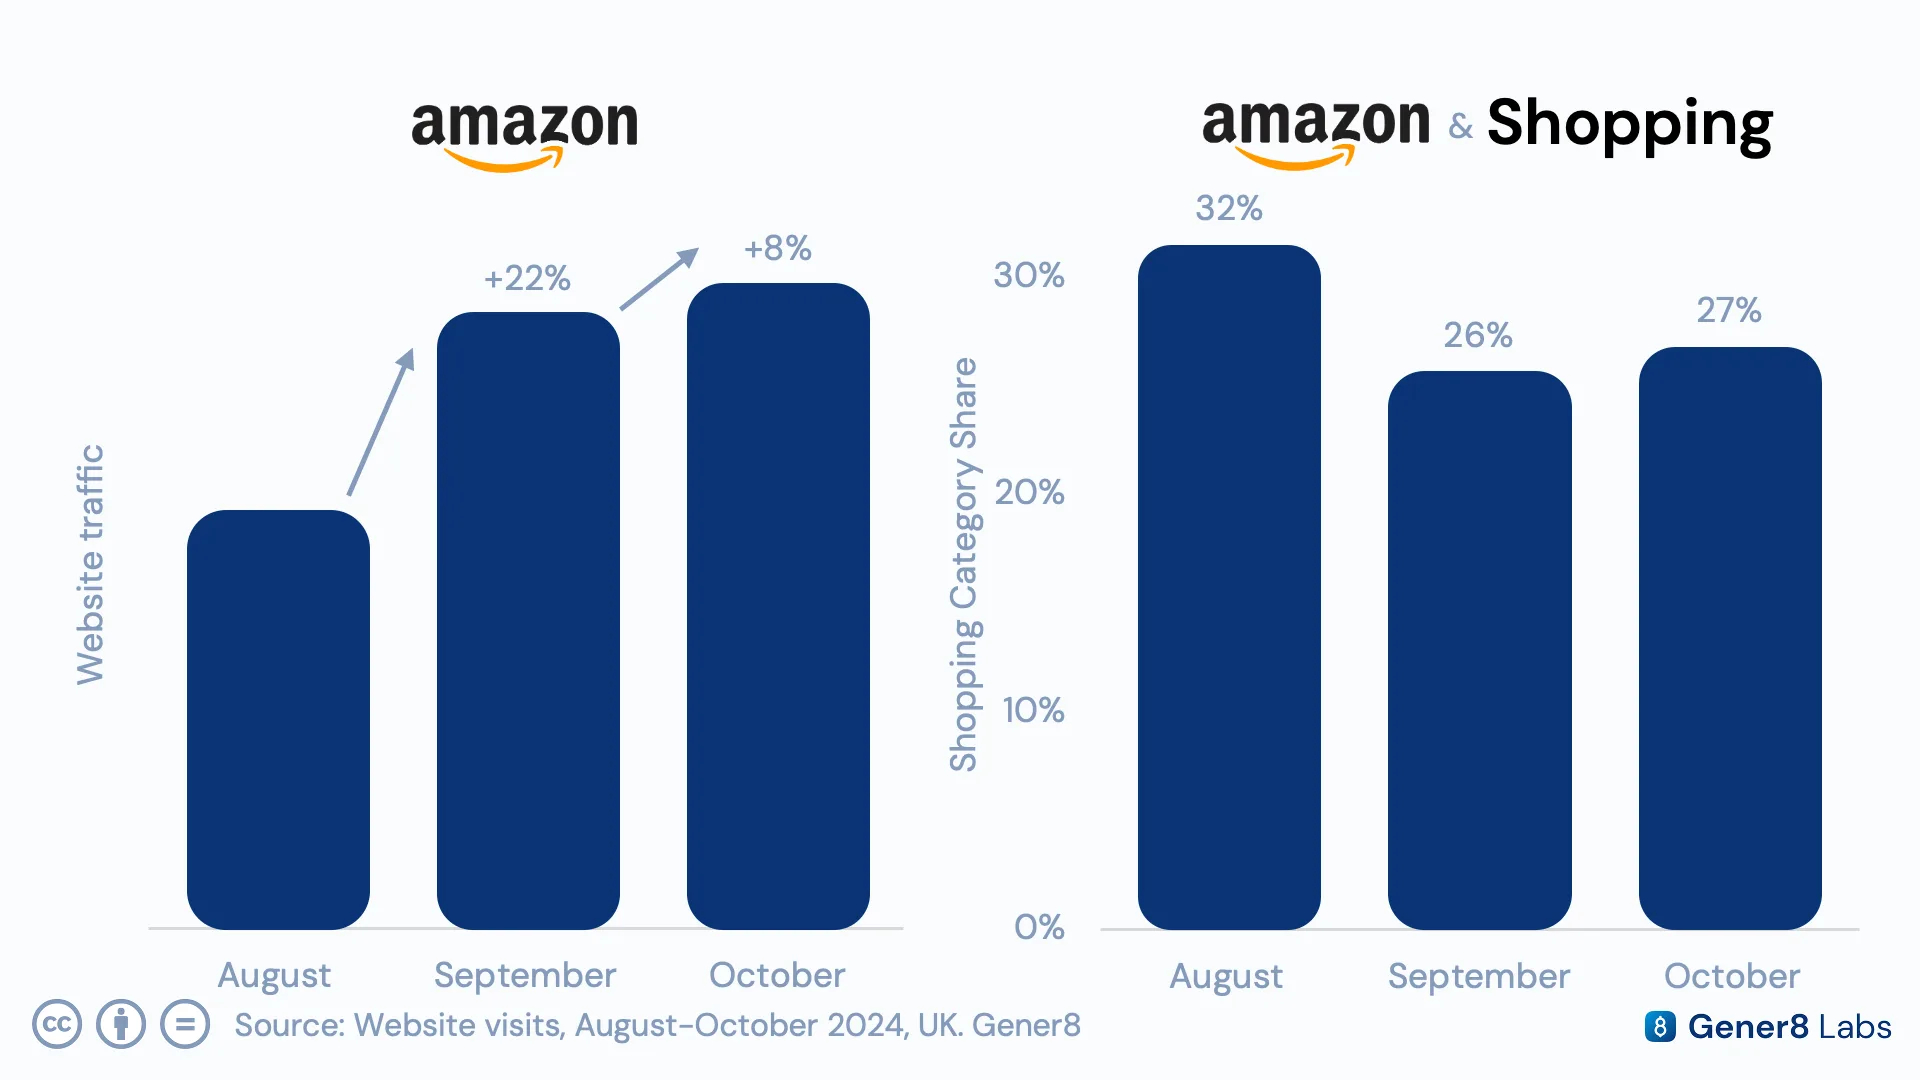
Amazon's own traffic grew 22% month over month between August and September, yet its share of the Shopping category actually fell, from 32% to 26%, over the same period. The category as a whole was growing even faster, a reminder that a brand can be expanding in absolute terms while quietly losing ground relative to the market around it.
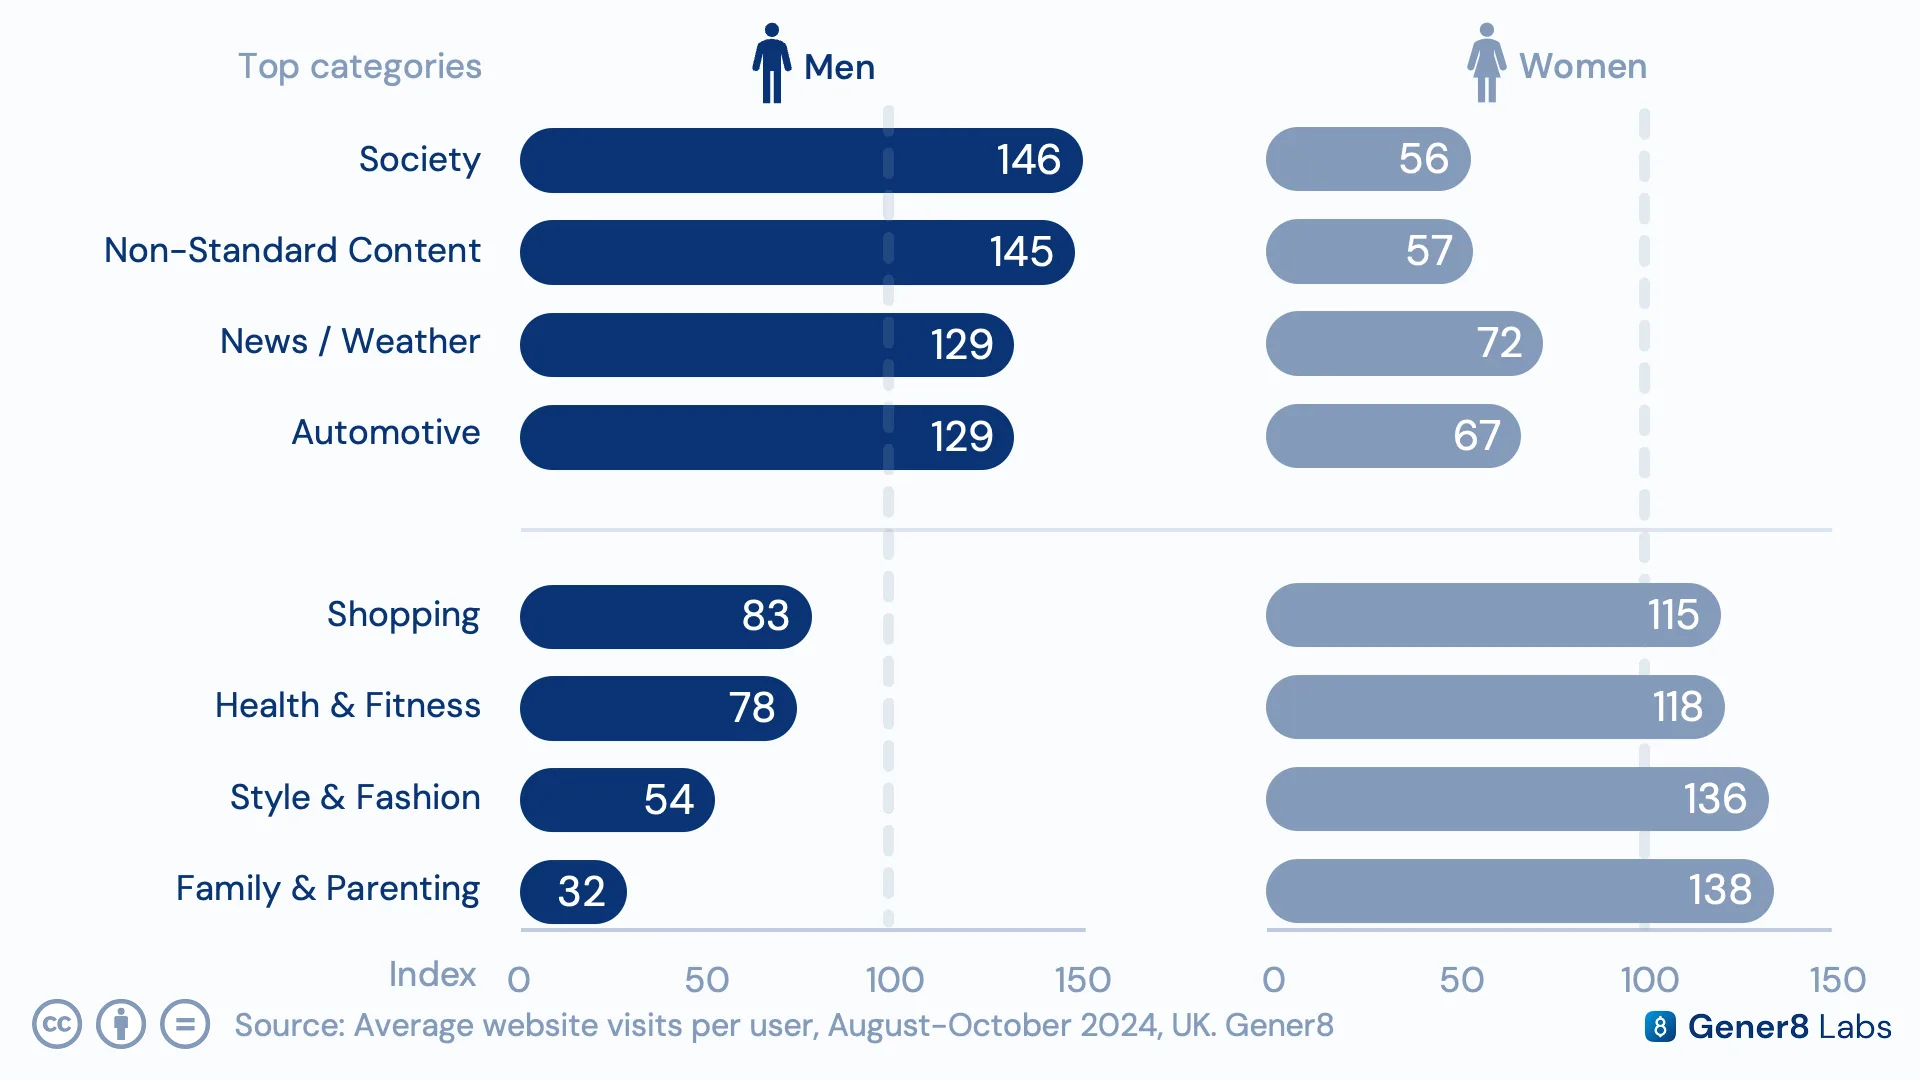
Layering demographics onto category traffic sharpens the picture further. Facebook, X, and automotive sites skew male, while Family & Parenting and Fashion & Style sites skew female.
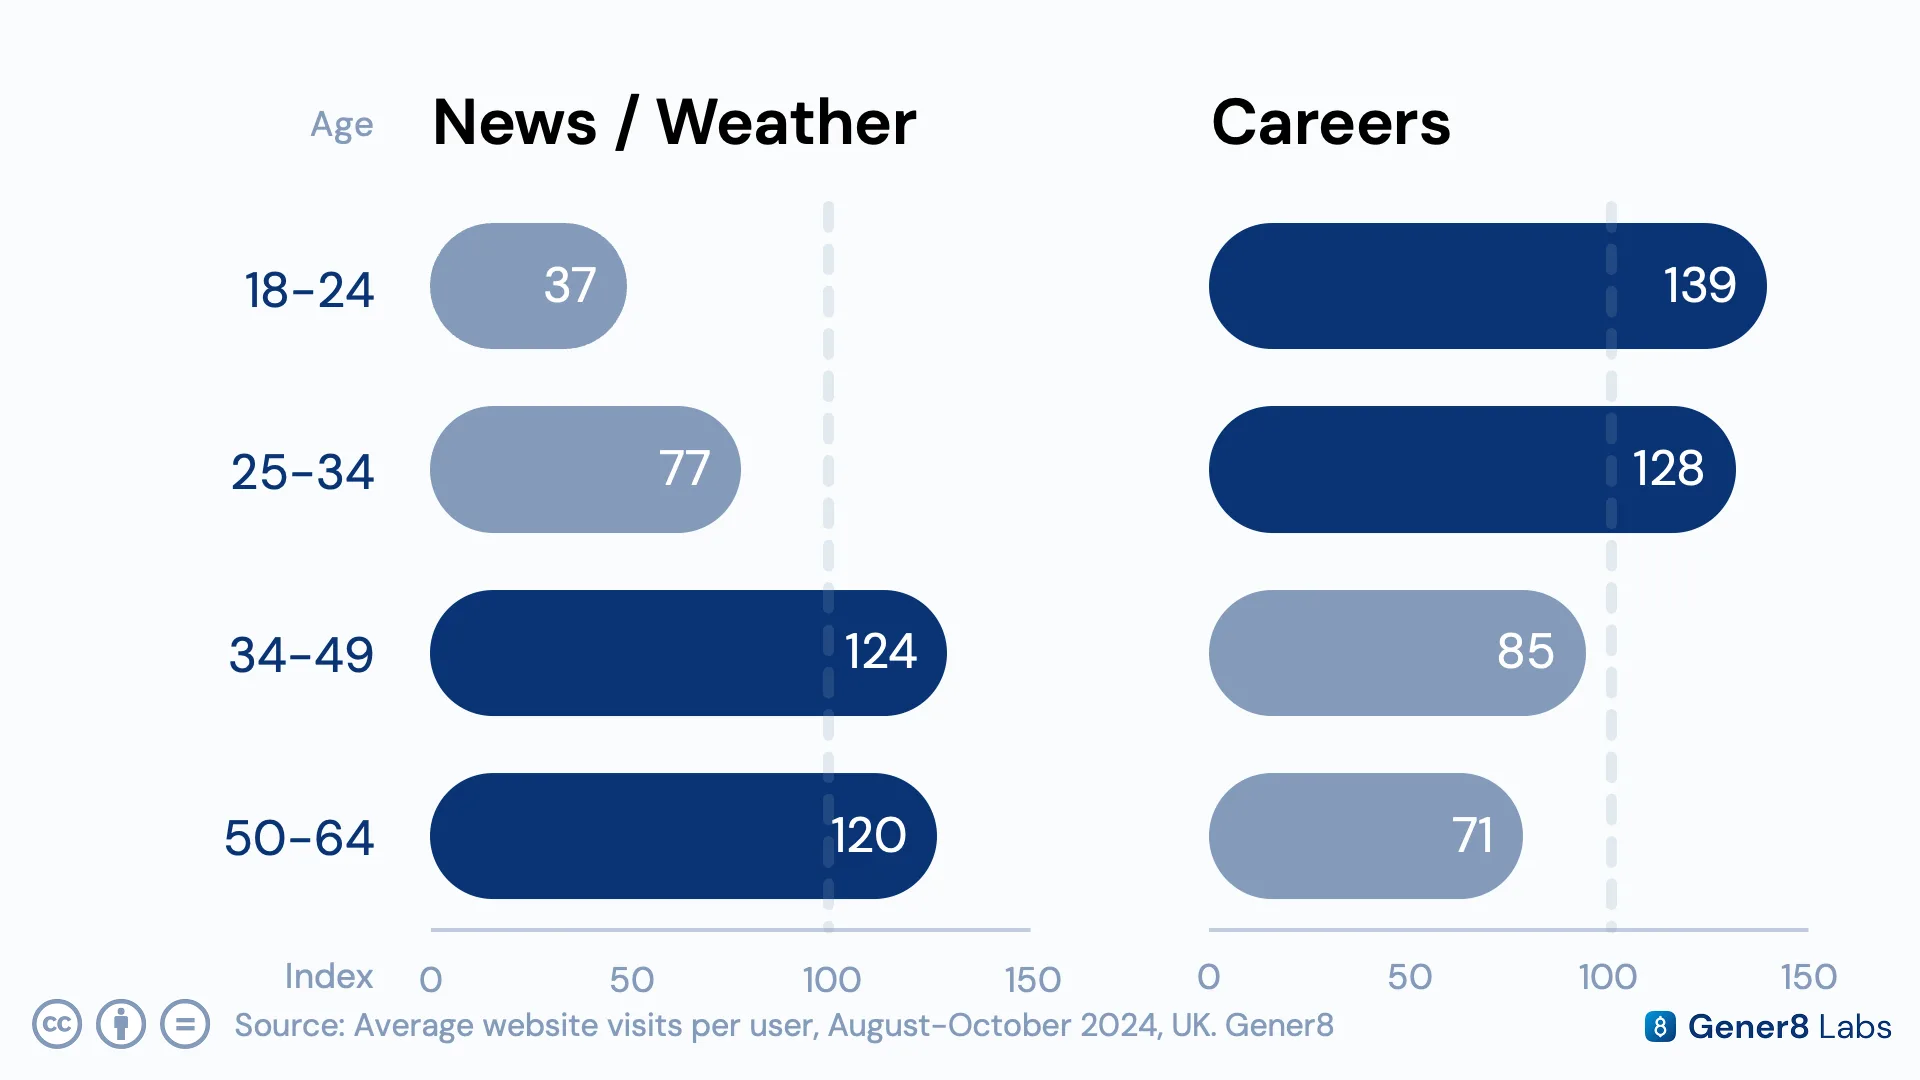
Age tells its own story: news and weather sites draw predominantly 34–64 year-olds, while job and careers platforms attract a distinctly younger, 18–34 audience, a useful signal for anyone building age-targeted media plans around career content.
This macro view of traffic and demographics gives media planners a way to spot category-level opportunities, benchmark individual sites against their peers, and catch seasonal shifts as they happen, all from Gener8's connected, first-party panel data. Get in touch to see the same breakdown for your own category.