
Bridging the Gap in Competitor Audience Analysis
February 17, 2025
Consumer BrowsingPurchase IntelligenceApp Usage
Leverages 100k UK users for demographic, attitudinal, and behavioural competitor insights.
Learn morePublished March 13, 2025
Nationally representative panel offers merchant, vendor, and item-level purchase insights.
We've expanded our nationally representative UK panel so that Purchase Intelligence and Consumer Browsing now sit side by side across the same 10,500-person sample, aged 18 to 64. That pairing lets us move from directional anecdotes to genuine population-level estimates of what the UK buys online, from whom, and how that spending connects to the rest of their digital behaviour.
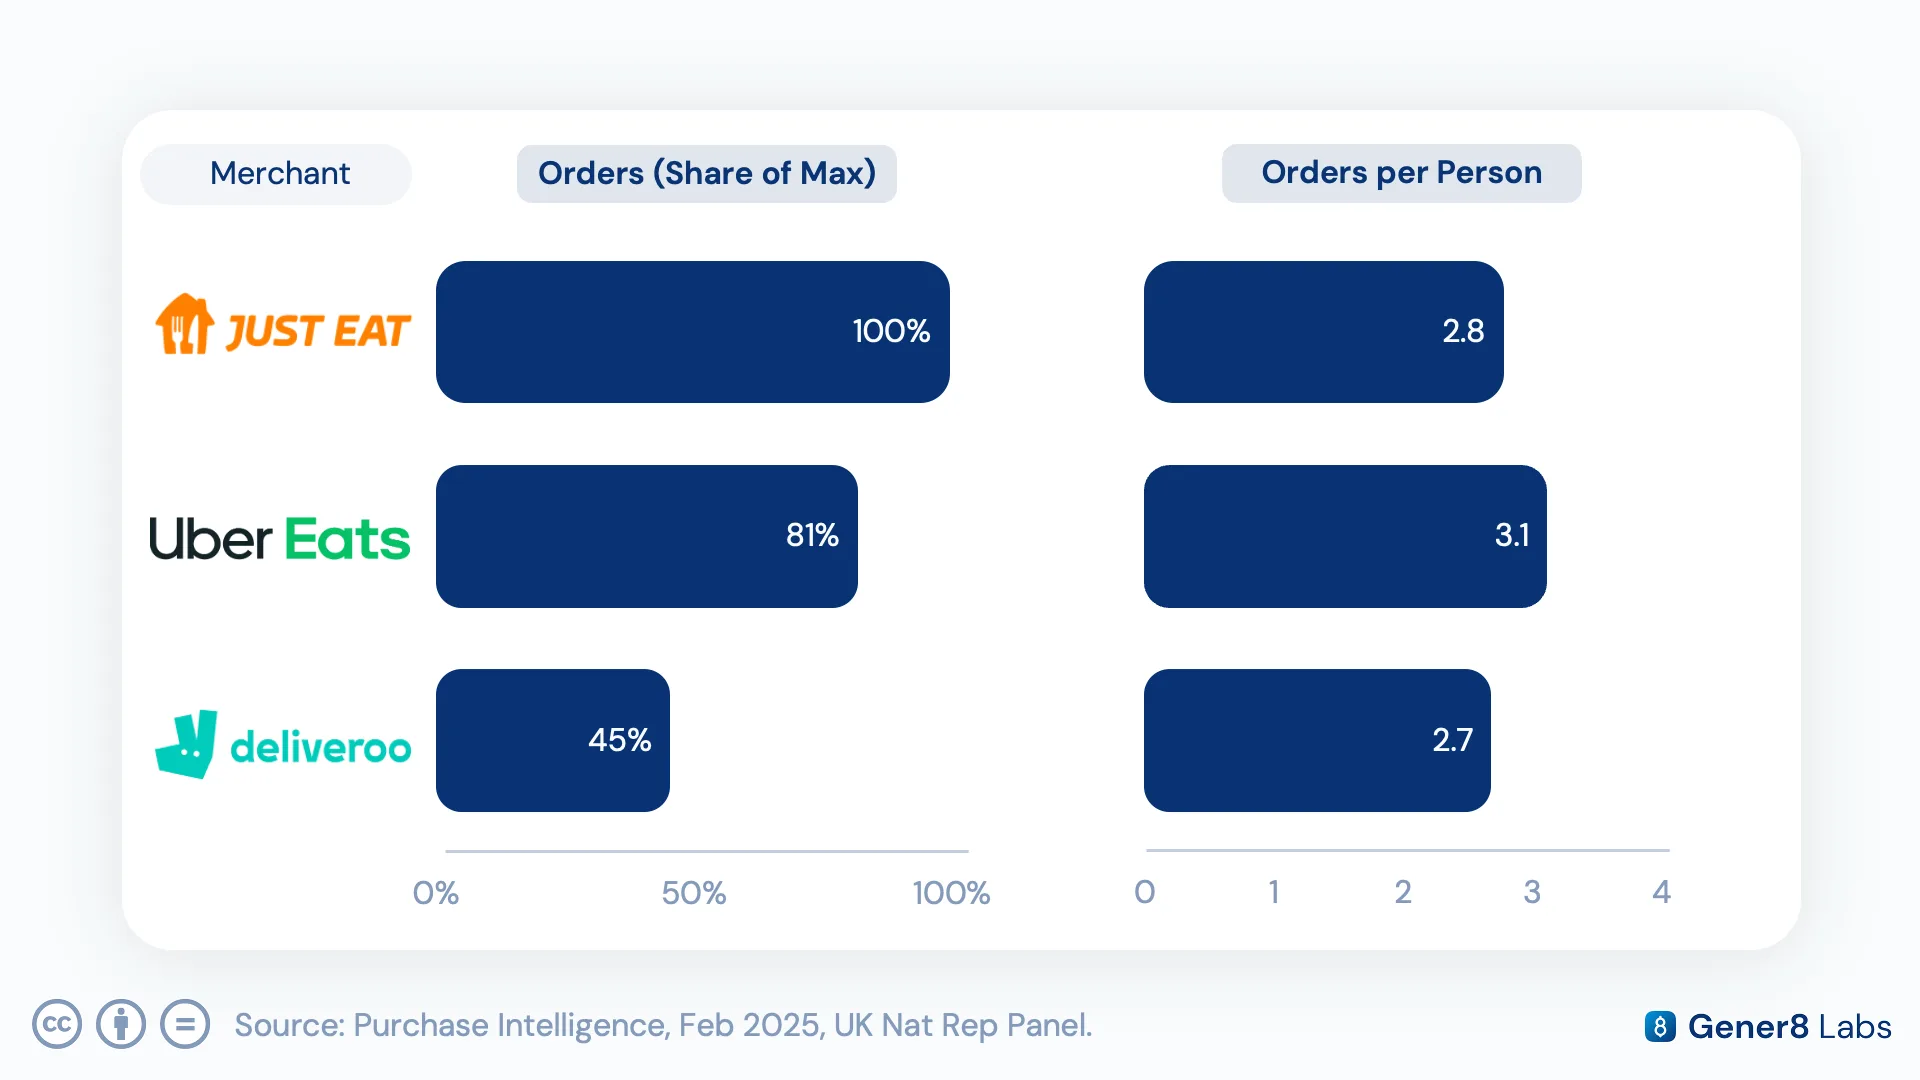
Because the panel is nationally representative, purchase activity observed within it can be projected outward into informed estimates of total purchasers and order volumes across the broader UK online population. In February, food delivery offered a clean example: Just Eat led the three major UK delivery services with an average of 2.8 orders per person over the month.
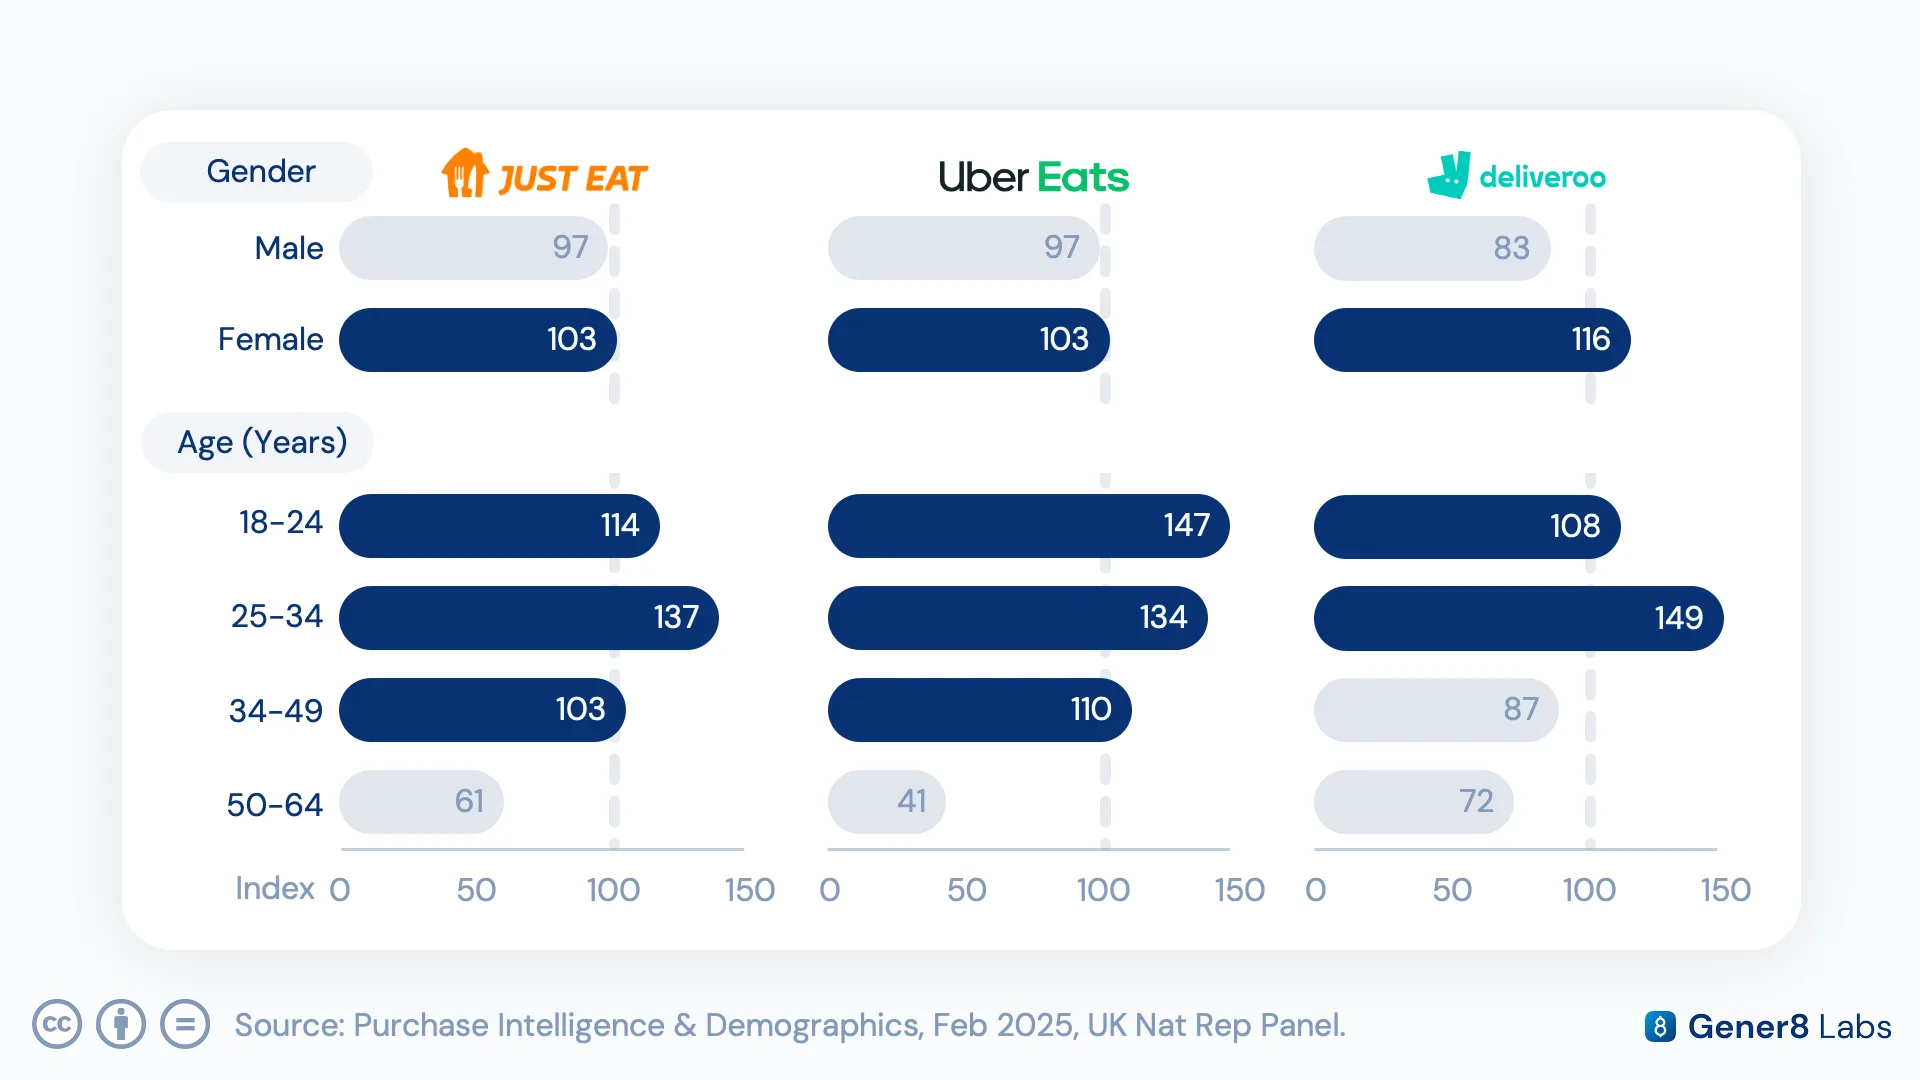
The demographic split was just as revealing. Just Eat and Uber Eats each drew a fairly even gender mix, while Deliveroo's user base skewed female. Age told its own story: Just Eat over-indexed with 25-34 year-olds, Uber Eats pulled stronger with 18-24 year-olds, and usage for both fell away steadily in older brackets.
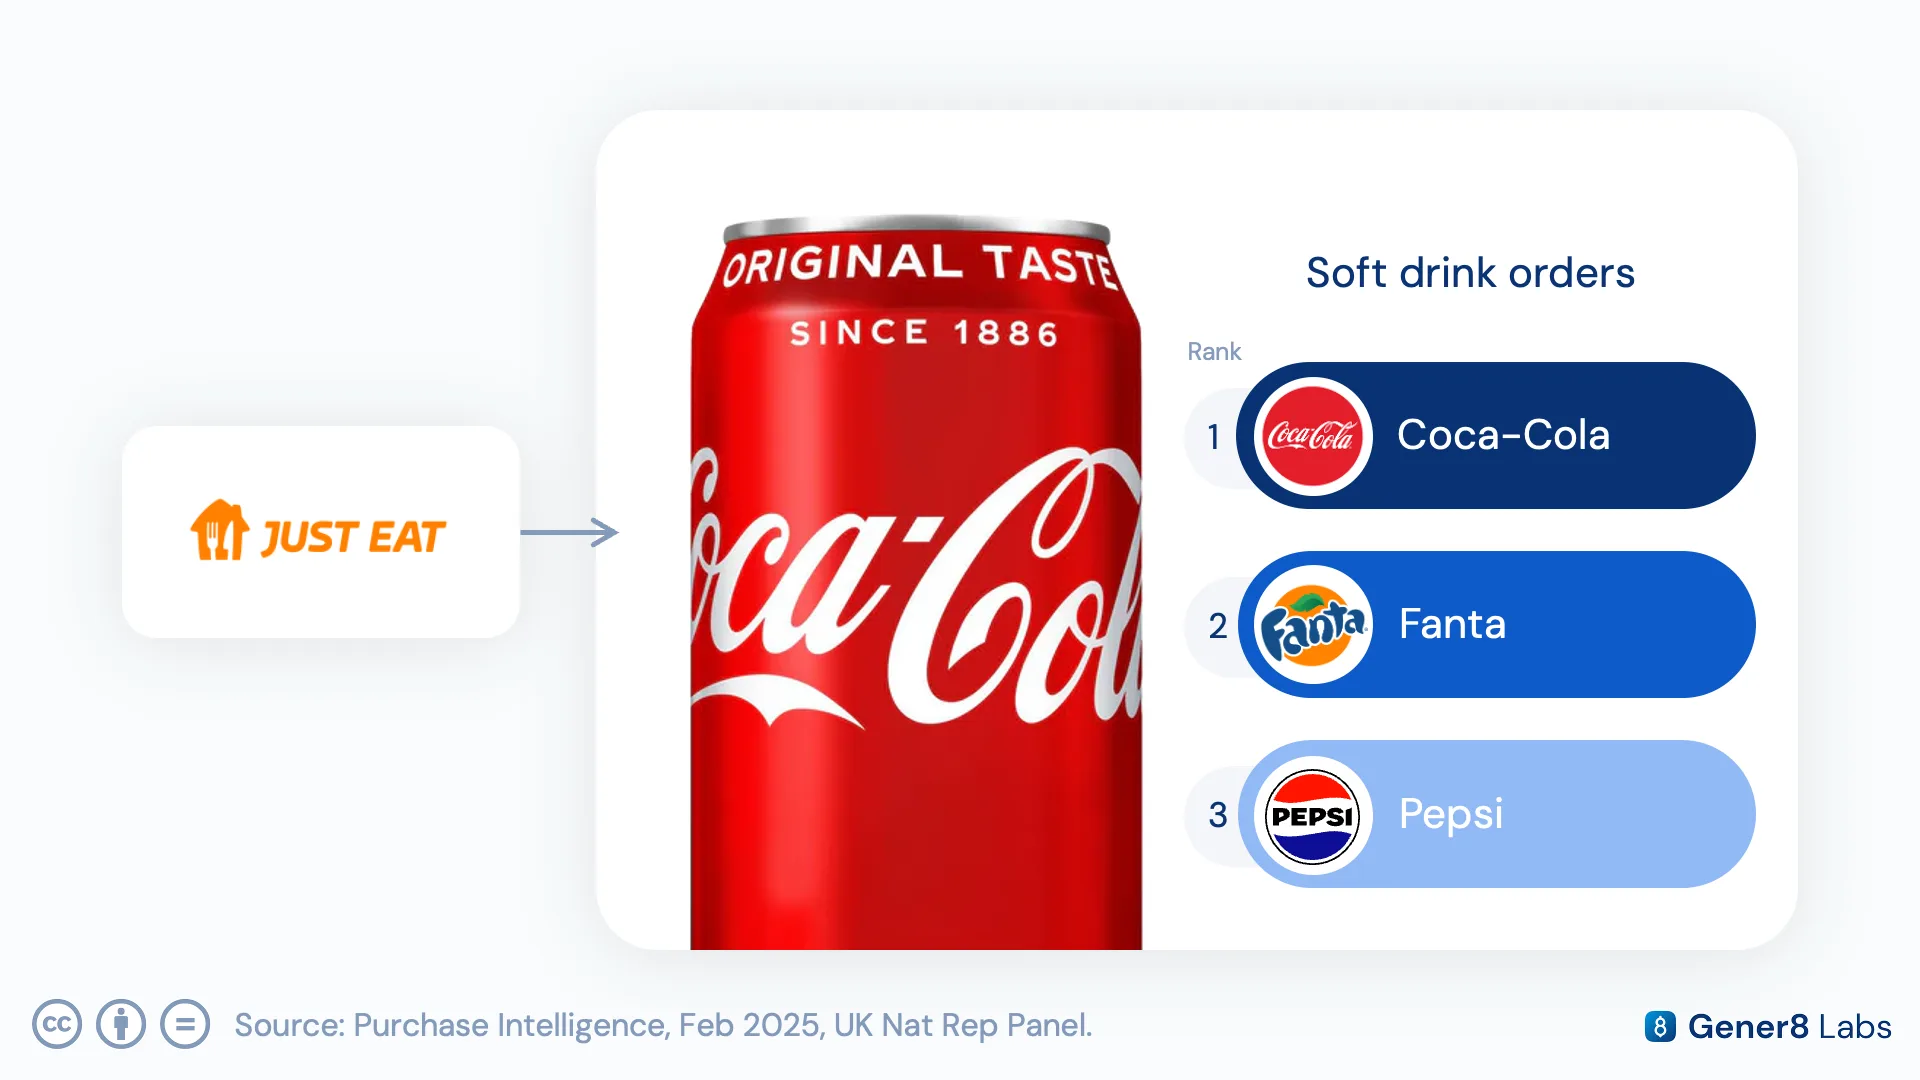
Purchase Intelligence doesn't stop at the merchant level: it goes deep enough to name the vendor and the item. In February, Coca-Cola was the single most-ordered soft drink through Just Eat, and McDonald's was the restaurant driving the largest share of those orders. That granularity turns a general 'delivery spend' category into a competitive map of specific brands winning specific baskets.
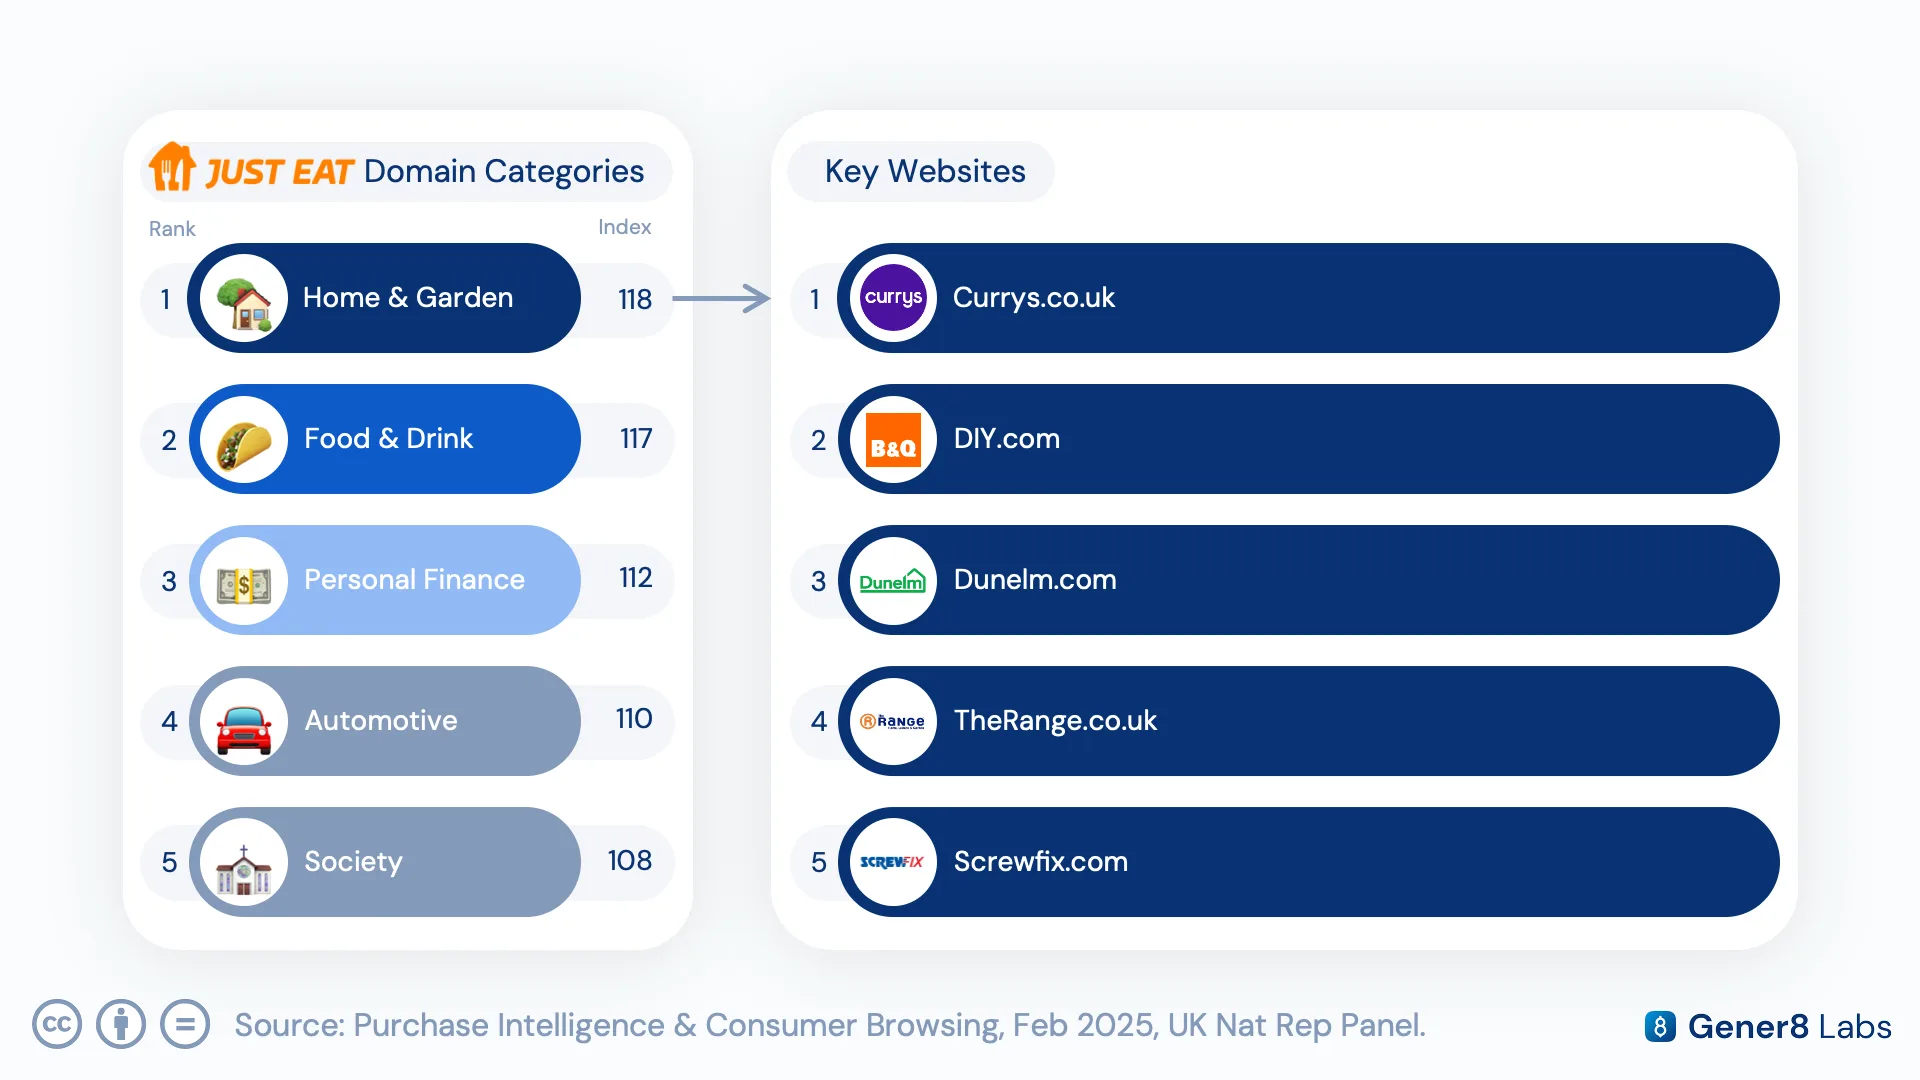
Because Purchase Intelligence and Consumer Browsing sit on the same panel and the same user ID, we can trace what a purchasing audience does elsewhere online. Just Eat customers, for instance, showed elevated browsing interest in Home & Garden, Food & Drink, and Personal Finance categories, with Currys.co.uk, DIY.com, and Dunelm.com ranking among their most-visited sites, context that a purchase record alone would never surface.
Put together, a nationally representative, cross-linked panel like this delivers four things researchers consistently need: a read on broad behavioural patterns across the population, the ability to contextualise findings against UK-specific events, credible estimates of how prevalent a behaviour actually is, and a clear view of the demographic differences driving it.
Get in touch to see how Gener8's nationally representative UK panel can benchmark your own category, vendor, or item-level purchase performance alongside the browsing behaviour that drives it.